
Running the plotting module#
After completing the analysis with the calculation module, the next step is to generate the visual reports. Below are the methods to run the plotting module.
Automatic Mode#
Once the calculation module has completed the analysis, the terminal will display where can you find your derivatives folder.
/path/to/your/dataset/derivatives/Meg_QC/calculation
Then in the terminal will ask you if Do you want to run the MEGqc plotting module on the MEGqc results? (y/n). Entering y will automatically start the plotting module.
Manual Mode#
To run the plotting module manually, use the following command in your terminal including a filepath to your root dataset folder, MEGqc will find the derivatives folder within the dataset.
run-megqc-plotting --inputdata </path/to/your/dataset/>
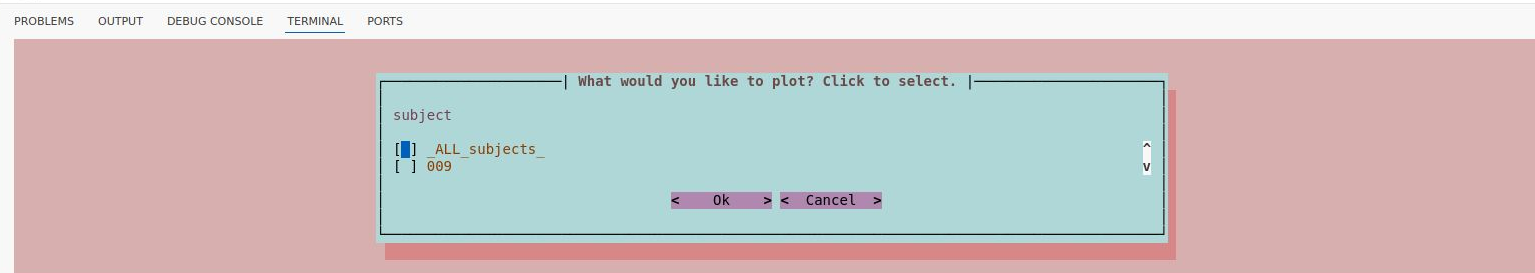
Interactive GUI#
After a short wait, the terminal will ask you several questions about specific parameters. The available options depend on the metadata in your dataset:
Subjects: ALL or a specific one
Sessions: ALL or a specific one
Tasks: ALL or a specific one
Runs: ALL or a specific one
Metrics: ALL or a specific one
Sensors: ALL, or only magnetometers or gradiometers
Congratulations!#
You’re done’! The HTML reports are now available in the derivatives folder of your dataset:
/path/to/your/dataset/derivatives/Meg_QC/reports/subject
Open these reports in Chrome or Firefox to explore the interactive plots and visualize of the quality control analysis of your dataset!