
Pipeline basics#
This section summarizes the MEGqc execution model and dependency roles.
General pipeline structure#
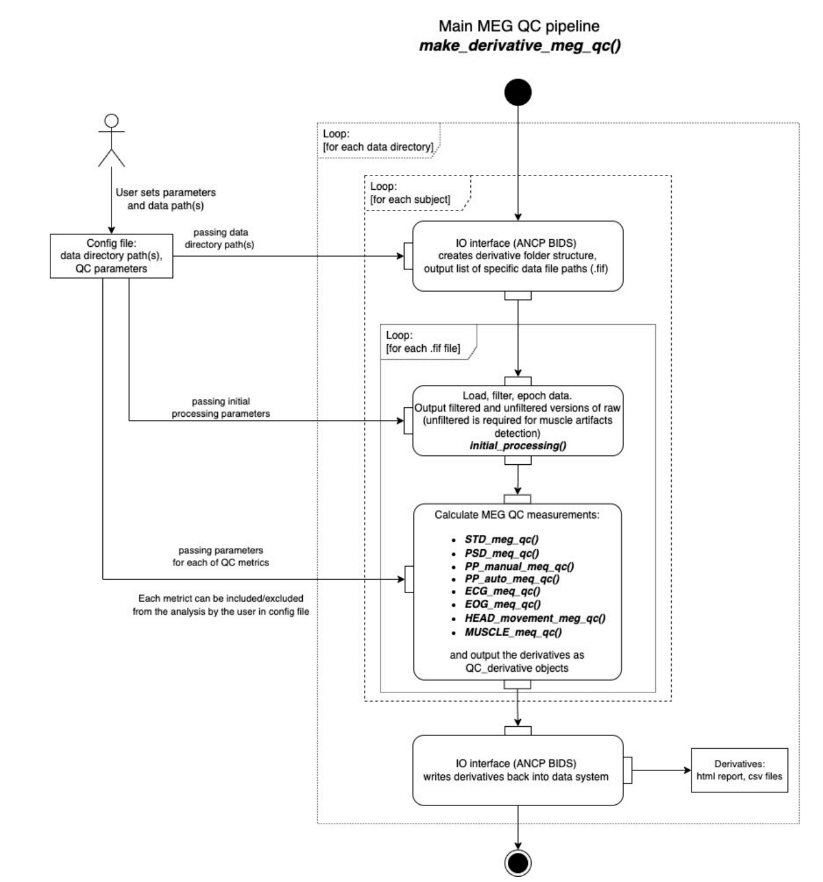
At high level:
Read runtime configuration (
settings.ini) and execution flags.Discover BIDS-compatible MEG data with ANCPBIDS.
Apply minimal preprocessing (crop/filter/resample/epoching).
Compute selected metric modules.
Write machine-readable derivatives (
TSV,JSON).Generate report layers from derivatives (subject/group/multisample; QA/QC).
Report levels#
QA Subject: per-subject interactive reports.
QA Group: dataset-level QA aggregation.
QA Multisample: cross-dataset QA comparison.
QC Group: GQI-based QC summary per dataset.
QC Multisample: cross-dataset QC comparison.
Derivative formats#
MEGqc uses machine-readable derivatives aligned with BIDS conventions:
JSON: structured summaries and metadata.
TSV: tabular metric-level details used by plotting and downstream processing.
Dependencies (what each one is used for)#
Core/direct dependencies in current package:
ancpbids: BIDS dataset traversal and derivatives handling.mne: MEG signal I/O and domain-specific signal processing.pandas: tabular computations and derivative tables.plotly: interactive report figures.joblib: subject-level parallelism.pyqt6: GUI framework.pyqt6-plugins(non-macOS): GUI platform plugin support.numba: acceleration for selected kernels (for example manual PtP paths).psutil: runtime system information in GUI (CPU/RAM awareness).matplotlib: auxiliary plotting utilities in selected report modules.prompt_toolkit: terminal UX utilities used by command-line workflows.
Additional libraries may appear as transitive dependencies via core packages.
Want to check more extra content?
Head back to the main extra content page to explore the others.