
Plotting Module (GUI)#
Plotting reads existing derivatives and creates HTML reports.
Step 1: Select datasets and profile mode#
In Inputs:
add one or more datasets,
select profile mode (
legacy/new/reuse/latest),optionally load/refresh profile IDs.
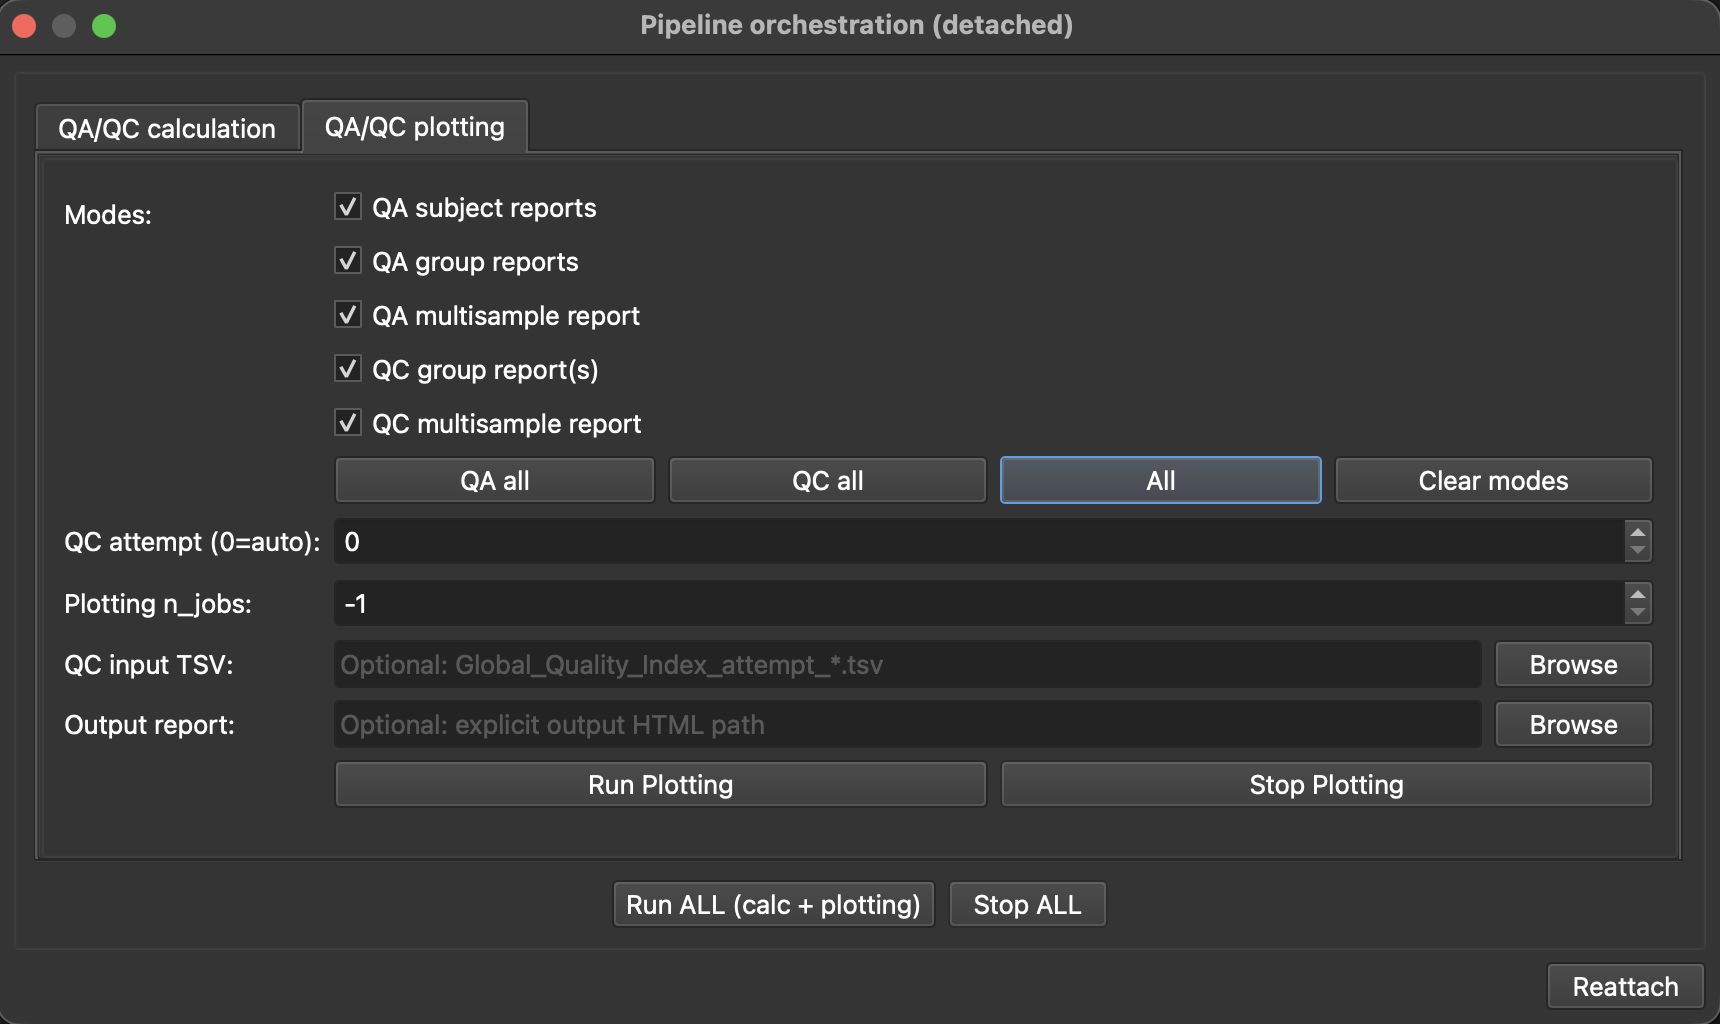
Step 2: Select plotting scopes#
In QA/QC plotting tab, enable one or more:
QA SubjectQA GroupQA Multisample(requires >=2 datasets)QC GroupQC Multisample(requires >=2 datasets)
Step 3: Optional controls#
QC attempt (0=auto)Plotting n_jobsQC input TSV(single-dataset QC Group)Output report(single-report modes)
Step 4: Run#
Click Run Plotting. Use Stop Plotting to abort.
Example GUI scenarios#
Scenario A: Subject + Group QA for one dataset#
Add one dataset.
Enable
QA SubjectandQA Group.Click Run Plotting.
Scenario B: QA multisample for two datasets#
Add dataset A and B.
Enable
QA Multisample.Click Run Plotting.
Scenario C: QC group with specific attempt#
Add one dataset.
Enable
QC Group.Set attempt value.
Click Run Plotting.