
EOG: Ocular Contamination#
EOG views quantify coupling between ocular reference activity and MEG channels.
For execution steps, see Tutorial.
Subject-report EOG views#
View |
Encoding |
What it reveals |
|---|---|---|
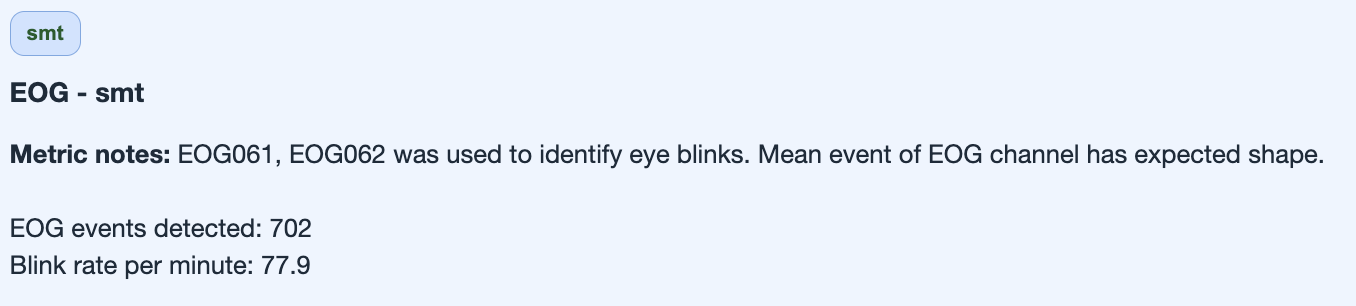
EOG quality overview |
reference-channel diagnostics |
whether blink/eye coupling analysis is reliable |
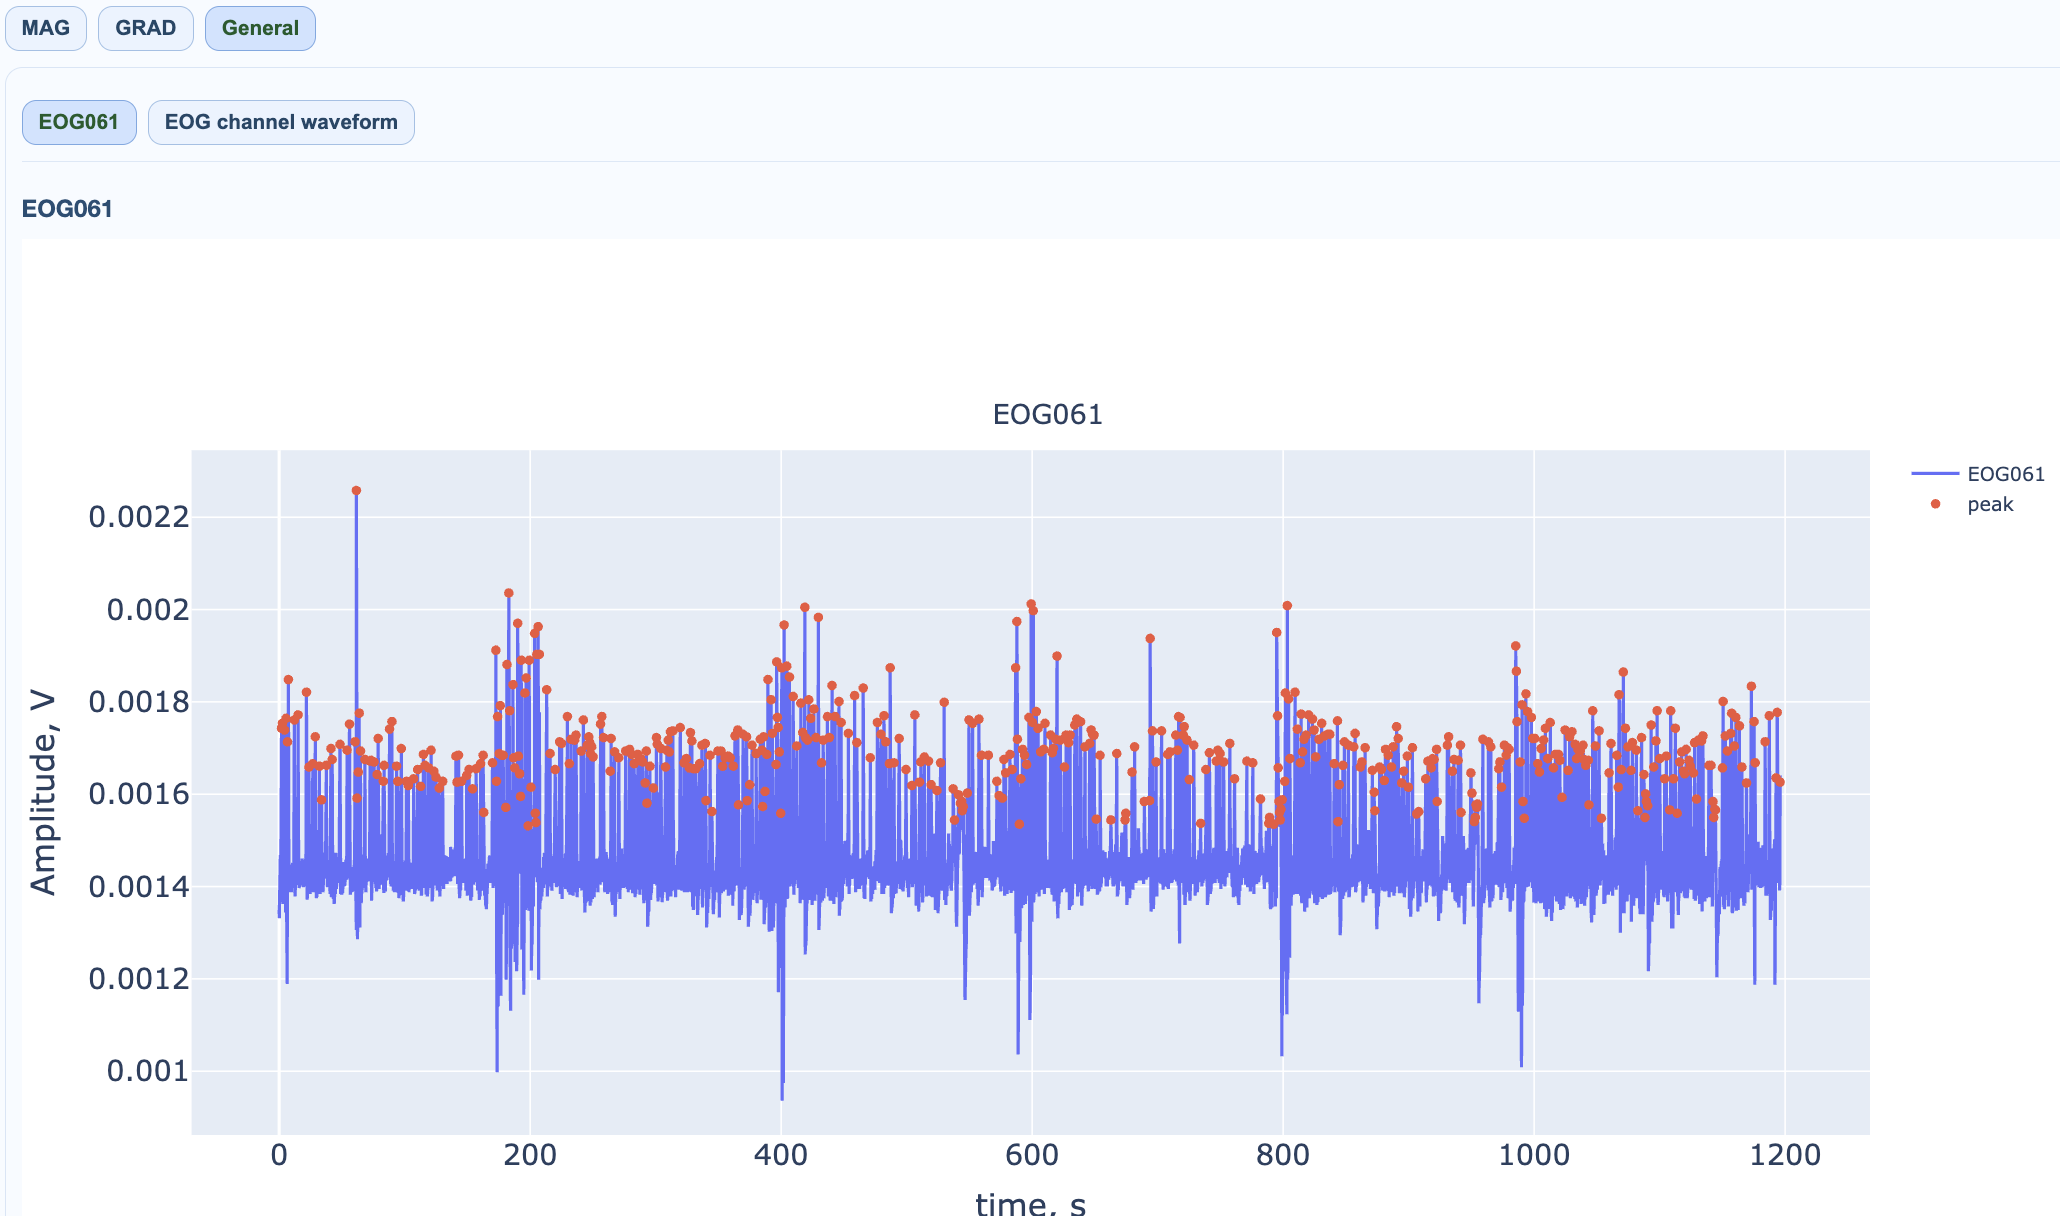
Raw EOG recording |
reference time series context |
blink quality and reference noise |
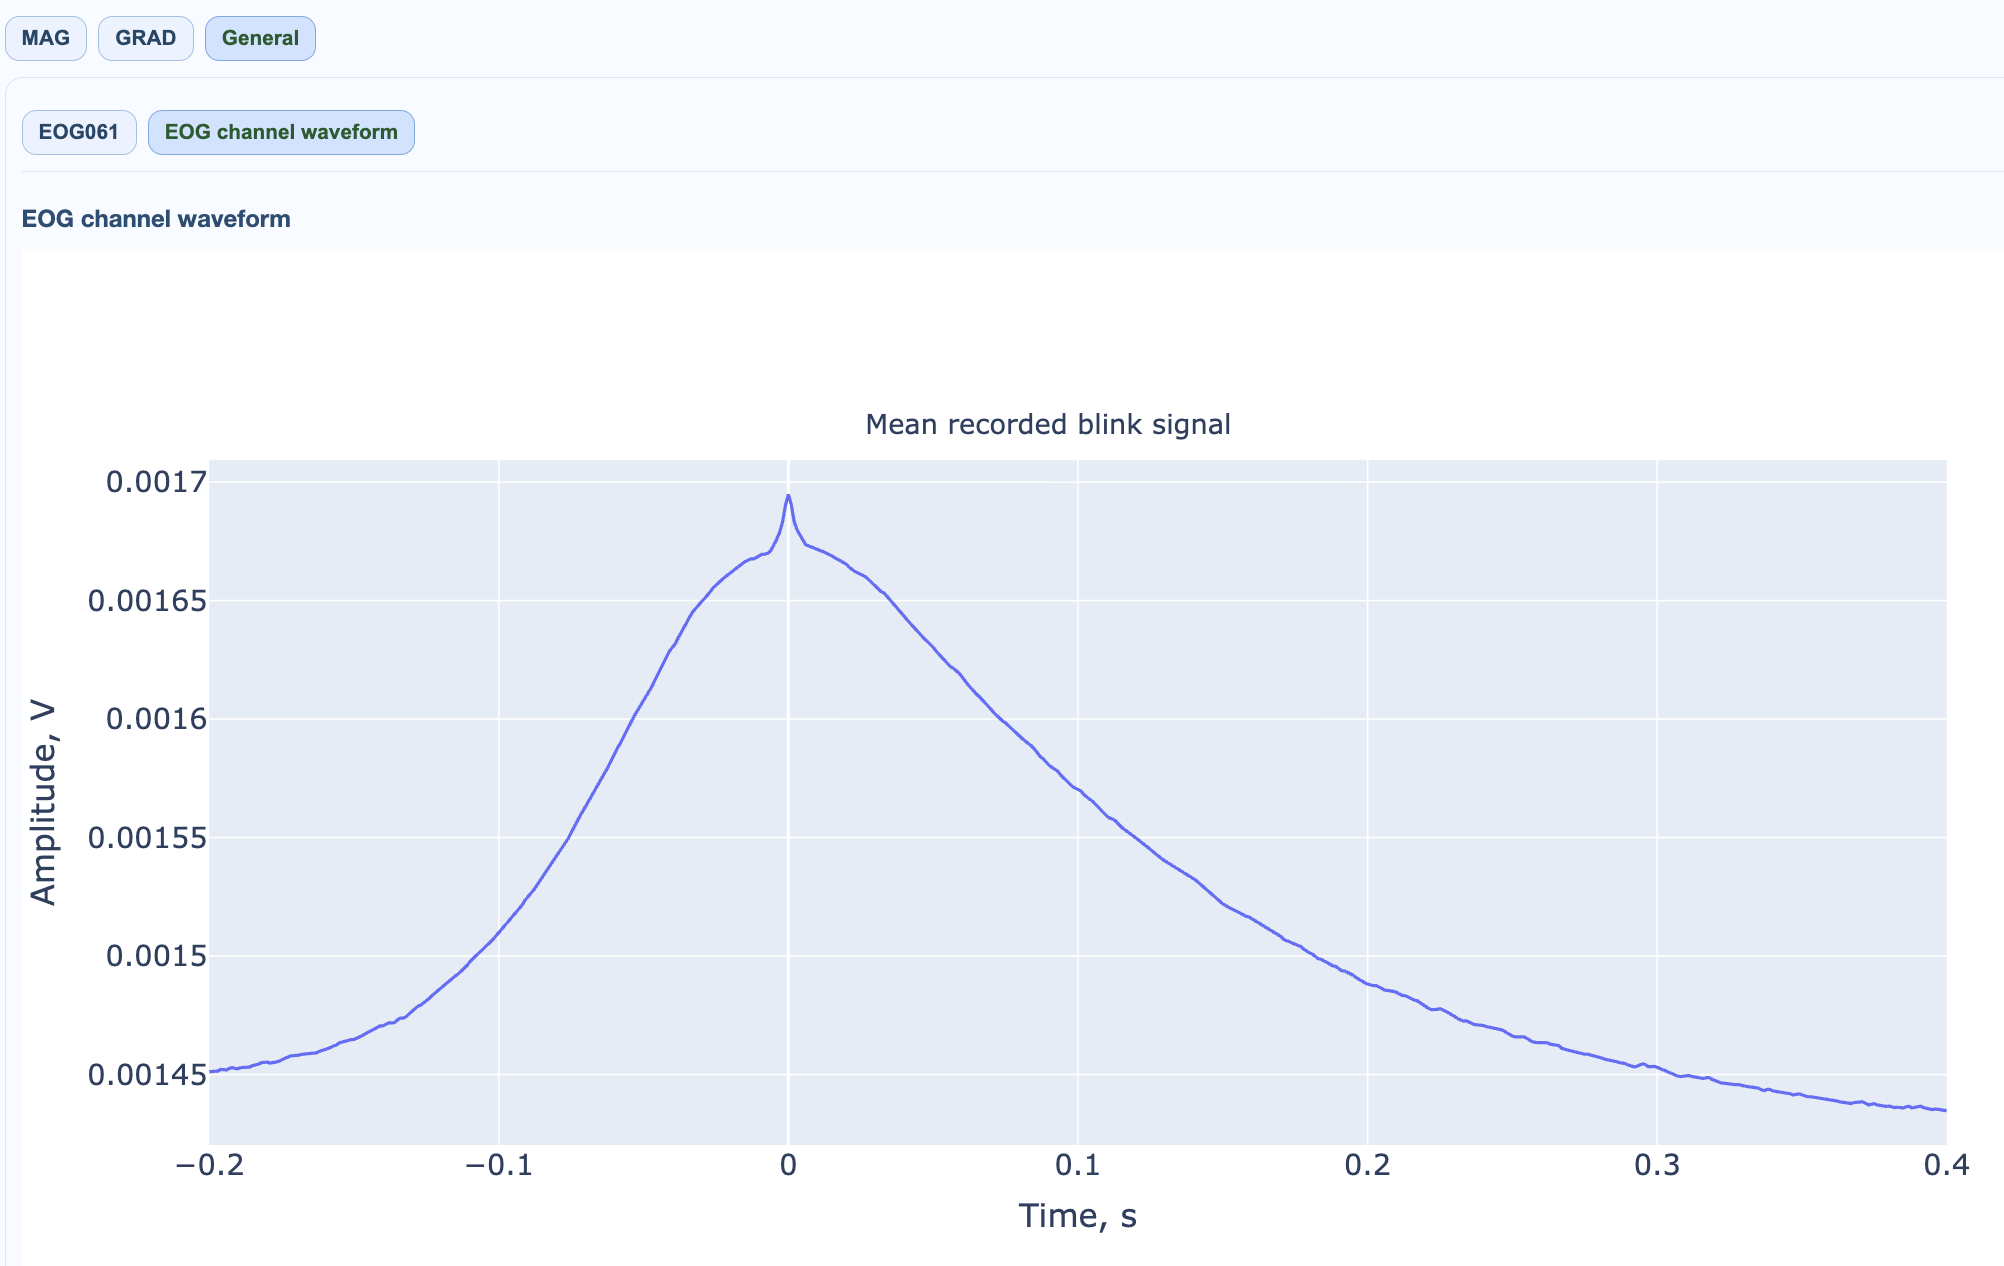
Mean blink template |
averaged blink waveform |
blink event consistency |
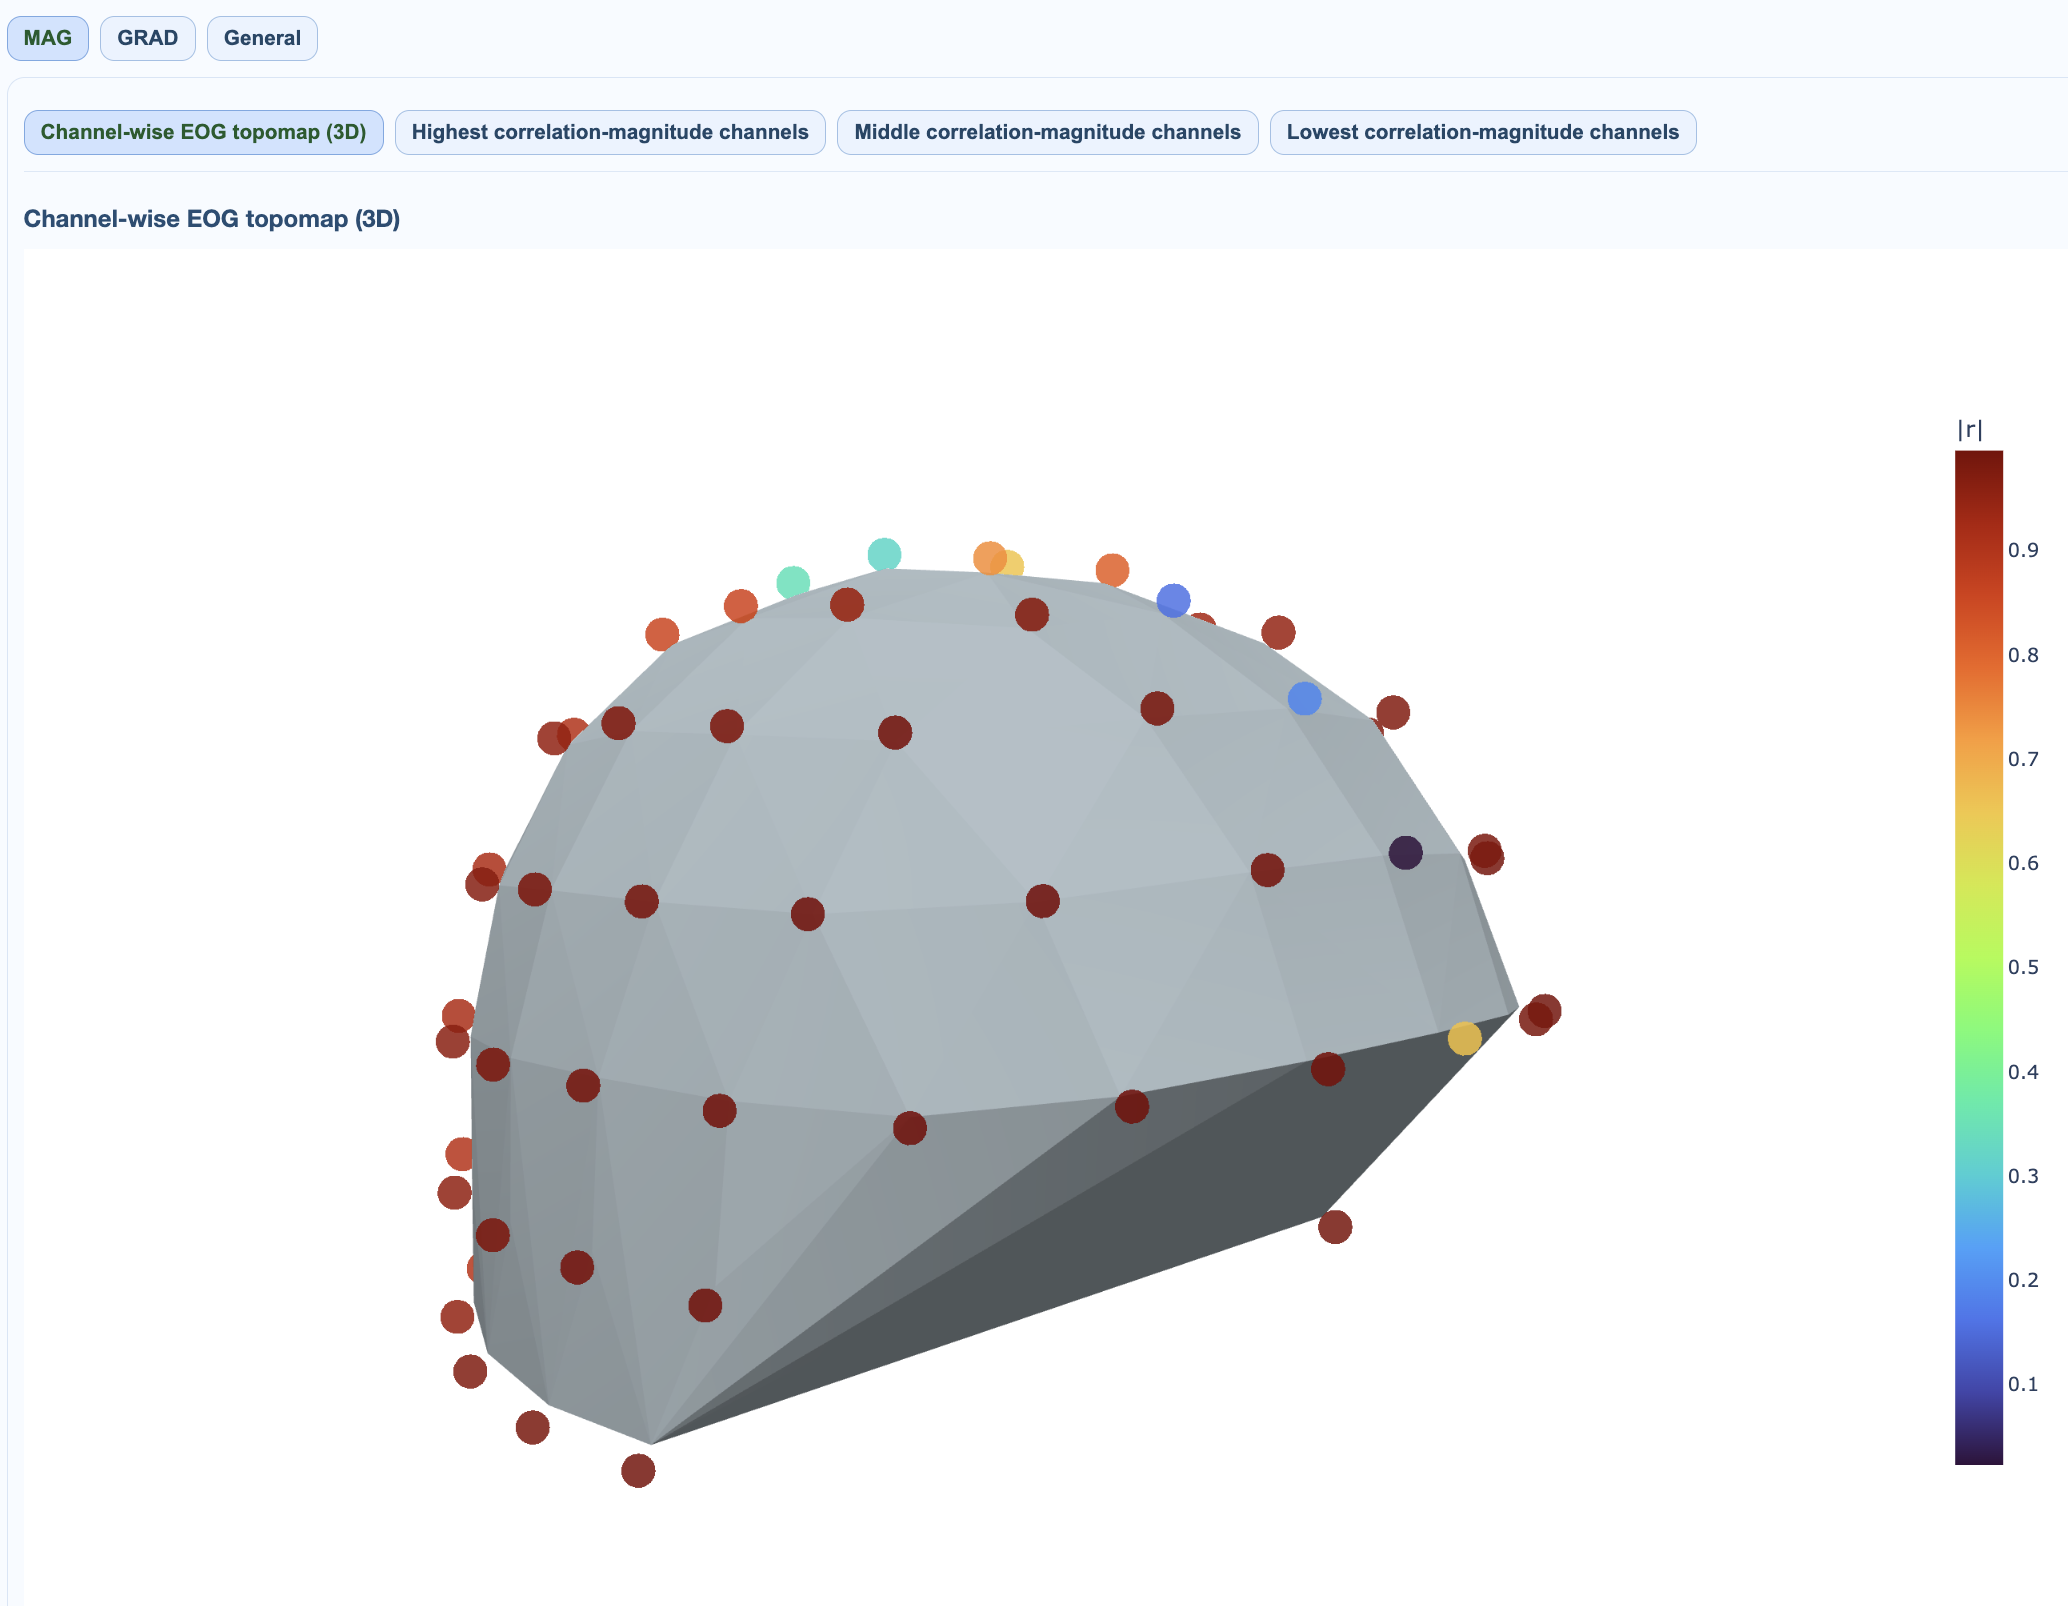
EOG topomap |
ocular burden over sensor layout |
spatial spread of eye-movement contamination |
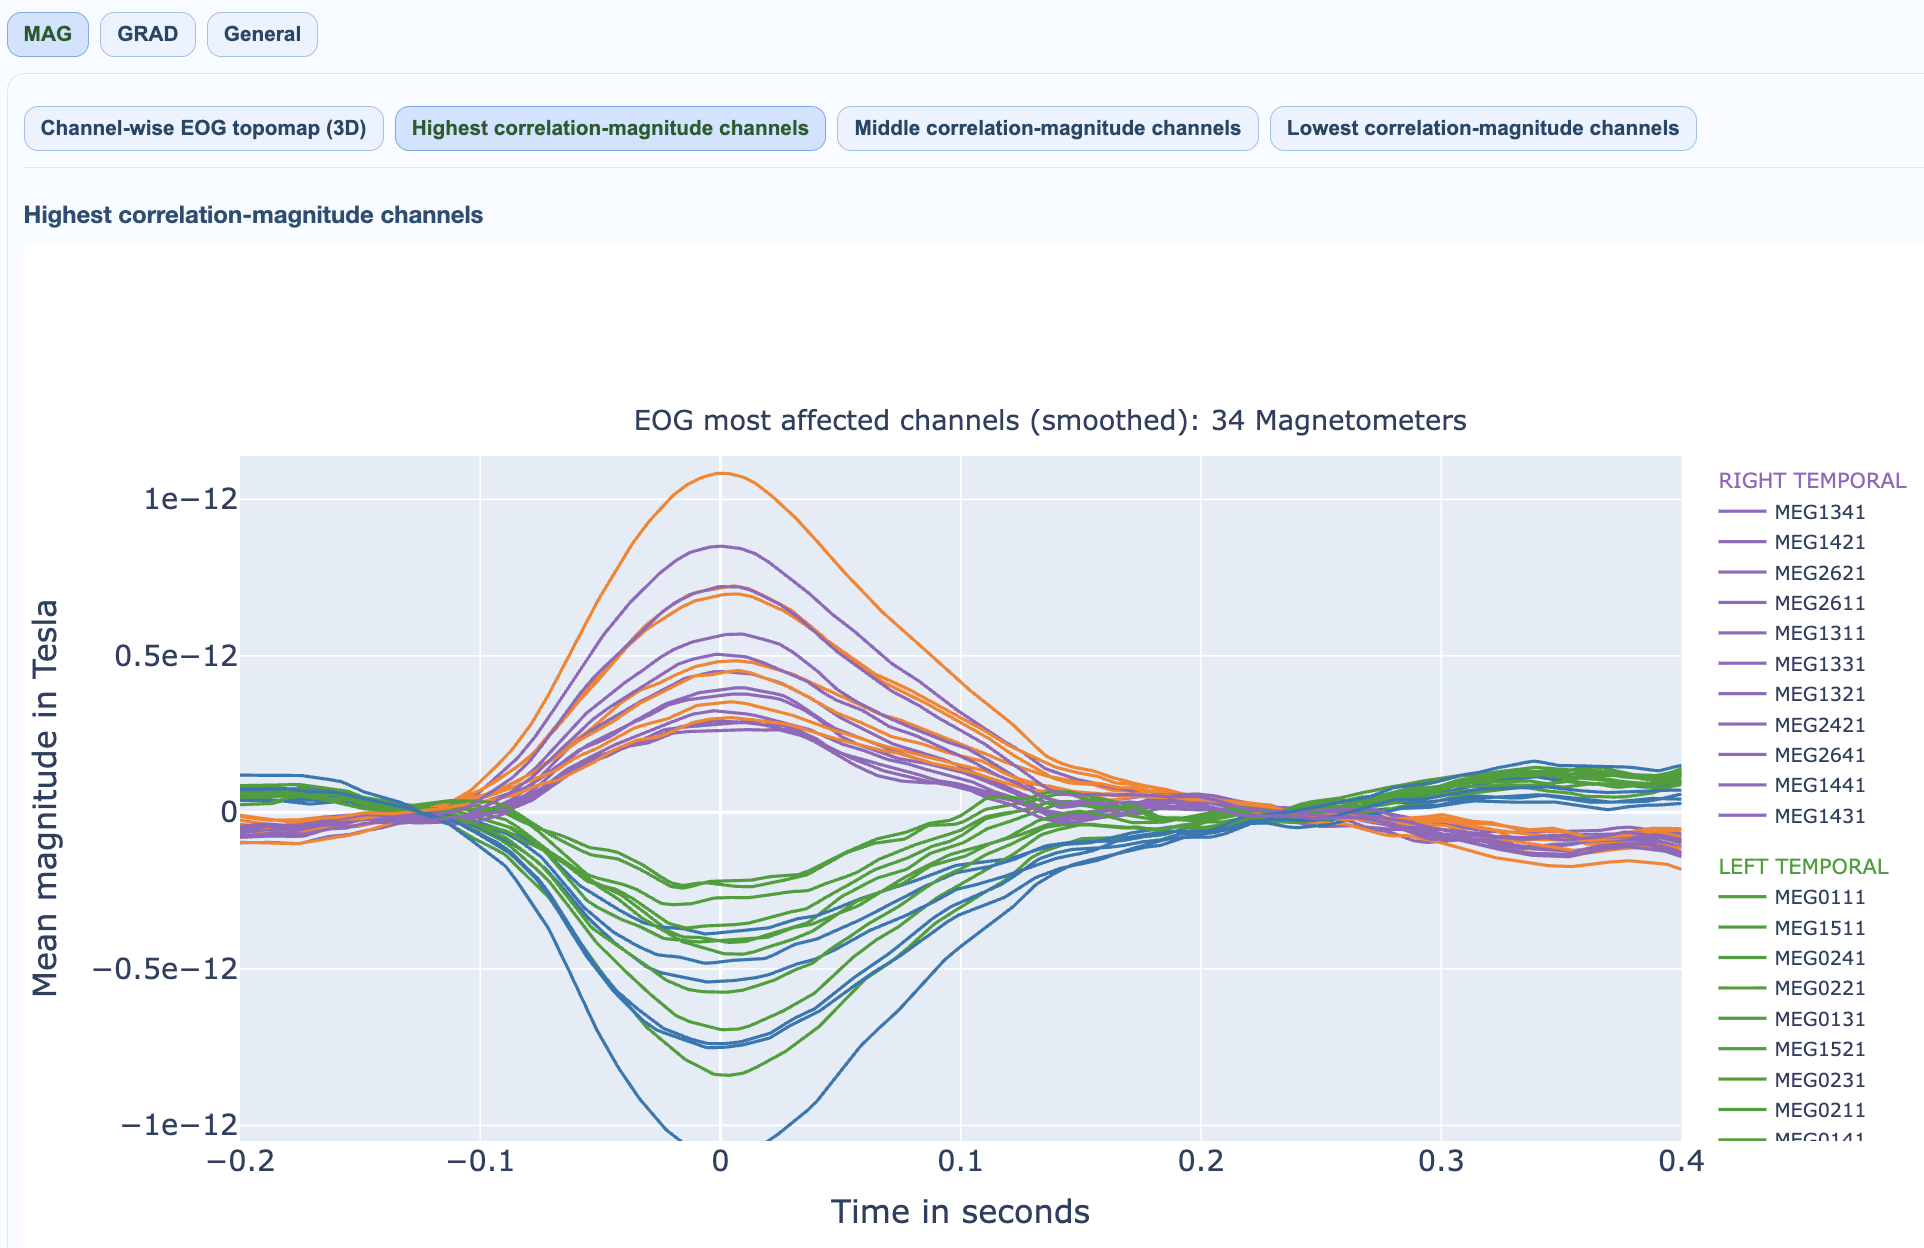
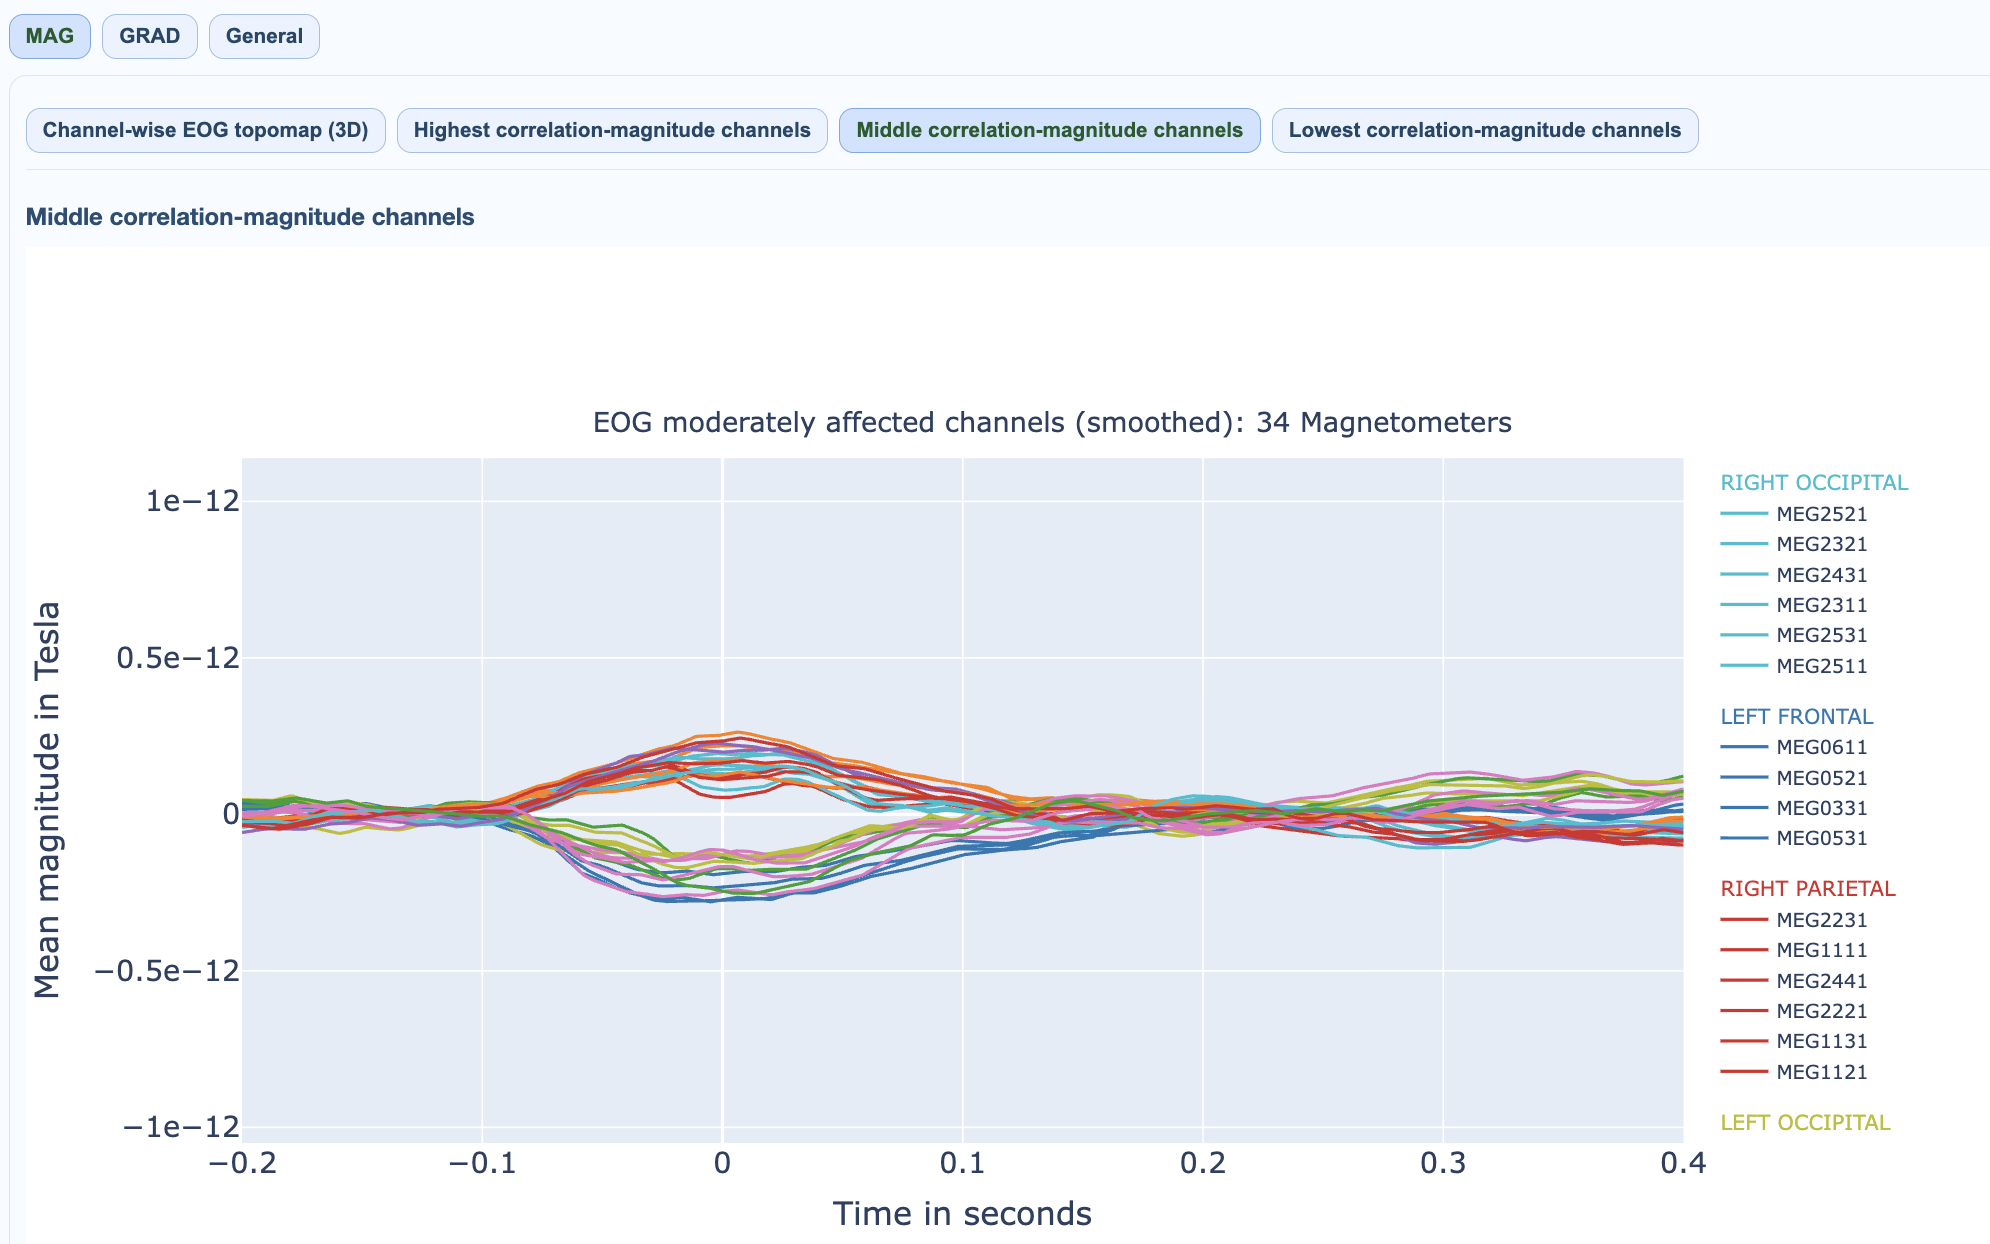
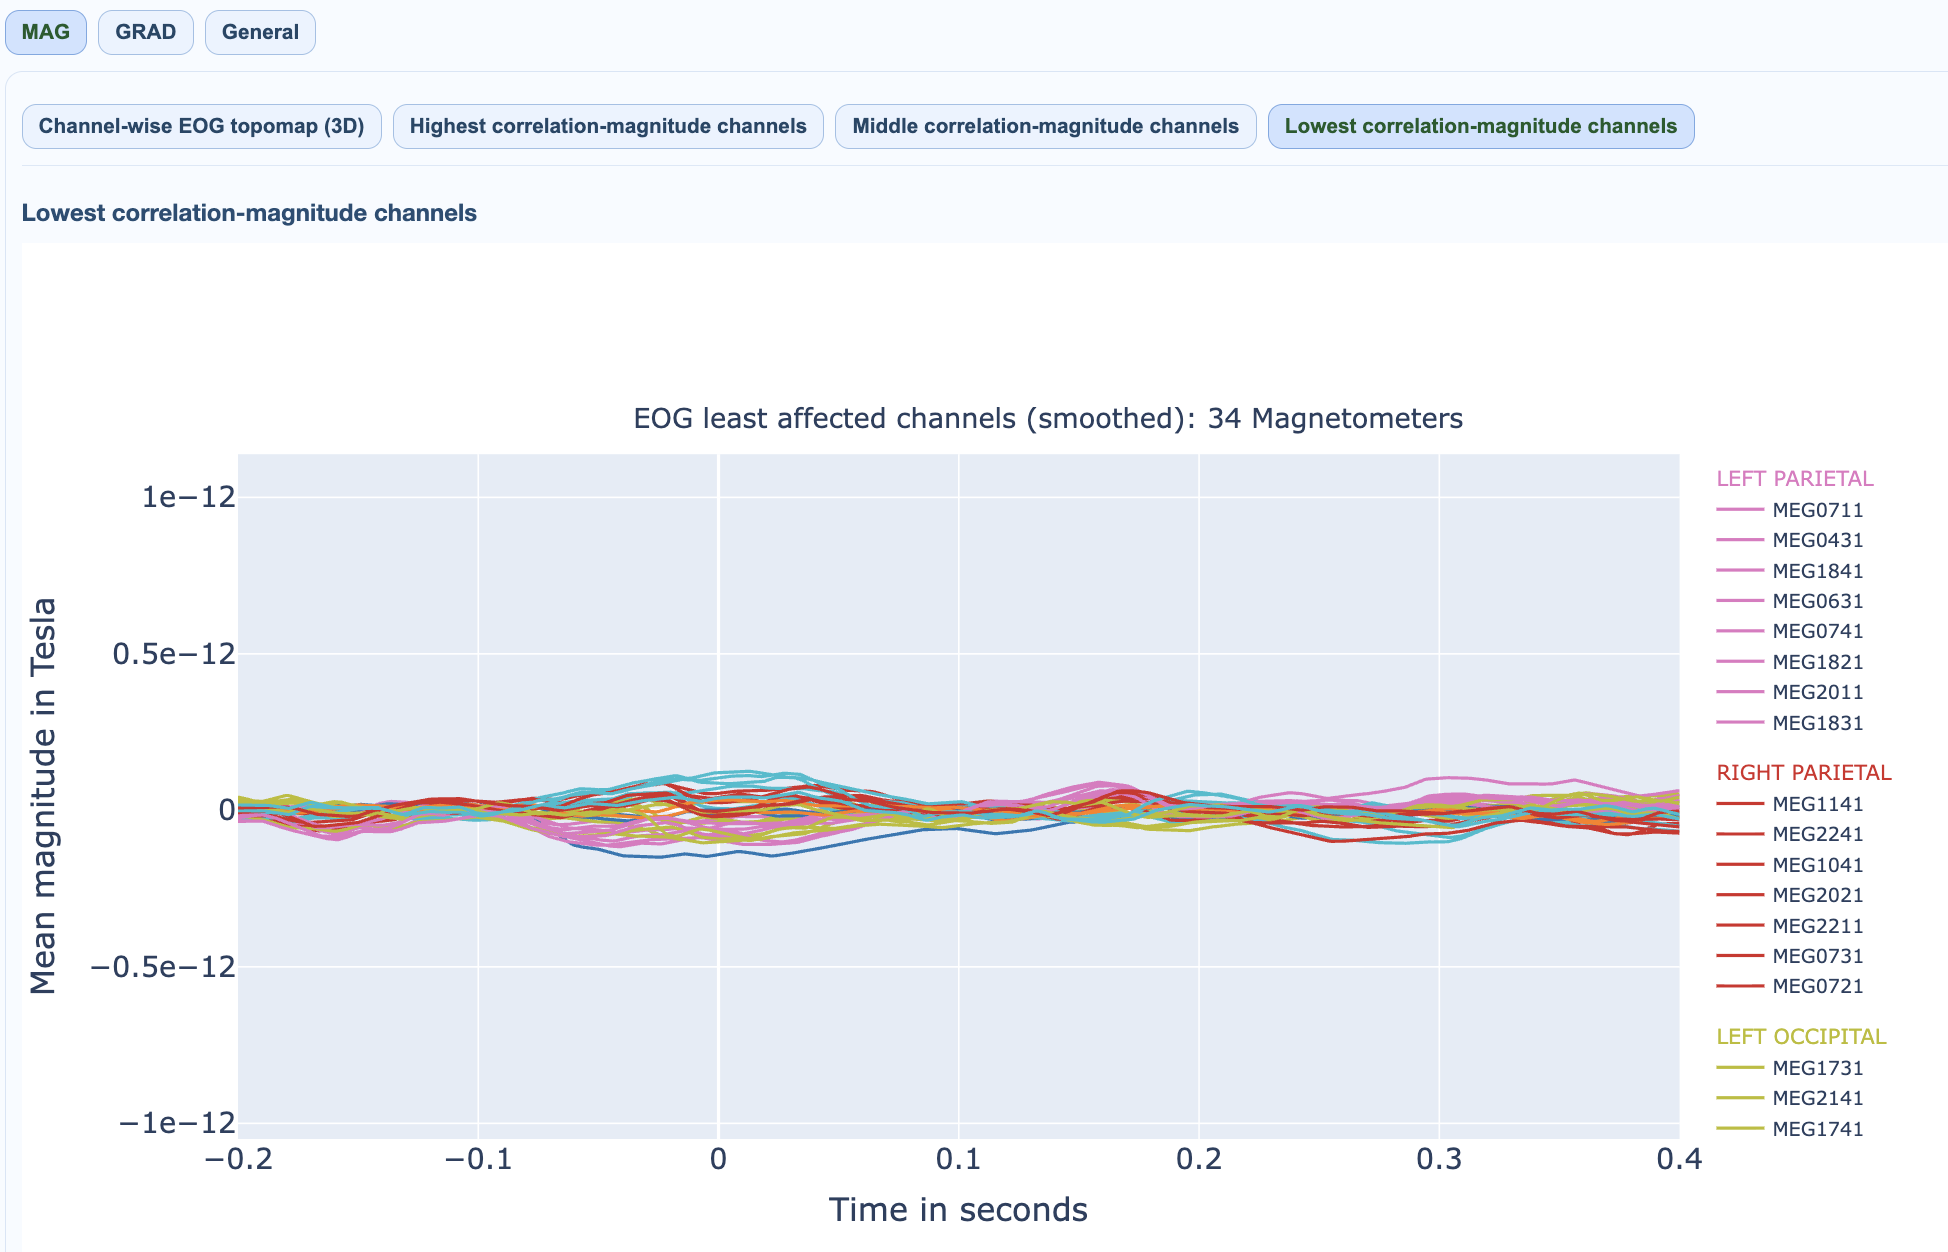
Affected-channel ranking |
channels ranked by ocular coupling |
strongest vs weakest ocular contamination |
1) EOG quality overview#
2) Raw EOG recording#
3) Mean blink template#
4) EOG contamination topomap#
5) Channel ranking by contamination#
EOG in QC summary#
QC summary -> EOG reports affected-channel counts and percentages (task/run-matched through GQI rows when available).
QC implications#
broad high coupling suggests strong blink/ocular burden,
anteriorly concentrated maps are common but still quantify burden for thresholding,
combine with task timing and behavior context before exclusion decisions.
EOG contamination typically shows strongest effects in frontal sensors. The QC summary provides affected-channel counts and percentages matched to GQI rows when available.