
Peak-to-Peak (PtP)#
Peak-to-peak (PtP) amplitude is max(signal) - min(signal) over the analyzed interval. It emphasizes transient excursions and outlier bursts.
For execution steps, see Tutorial.
Subject-report PtP views#
View |
Encoding |
What it reveals |
|---|---|---|
Channel-wise topomap (3D) |
one PtP value per channel in sensor space |
spatial pattern of excursion burden |
Channel-wise distribution |
one PtP value per channel |
outlier channels and heavy-tail behavior |
Channel × epoch heatmap |
PtP per channel and epoch |
when/where transient bursts occur |
1) Channel-wise PtP topomap (3D)#
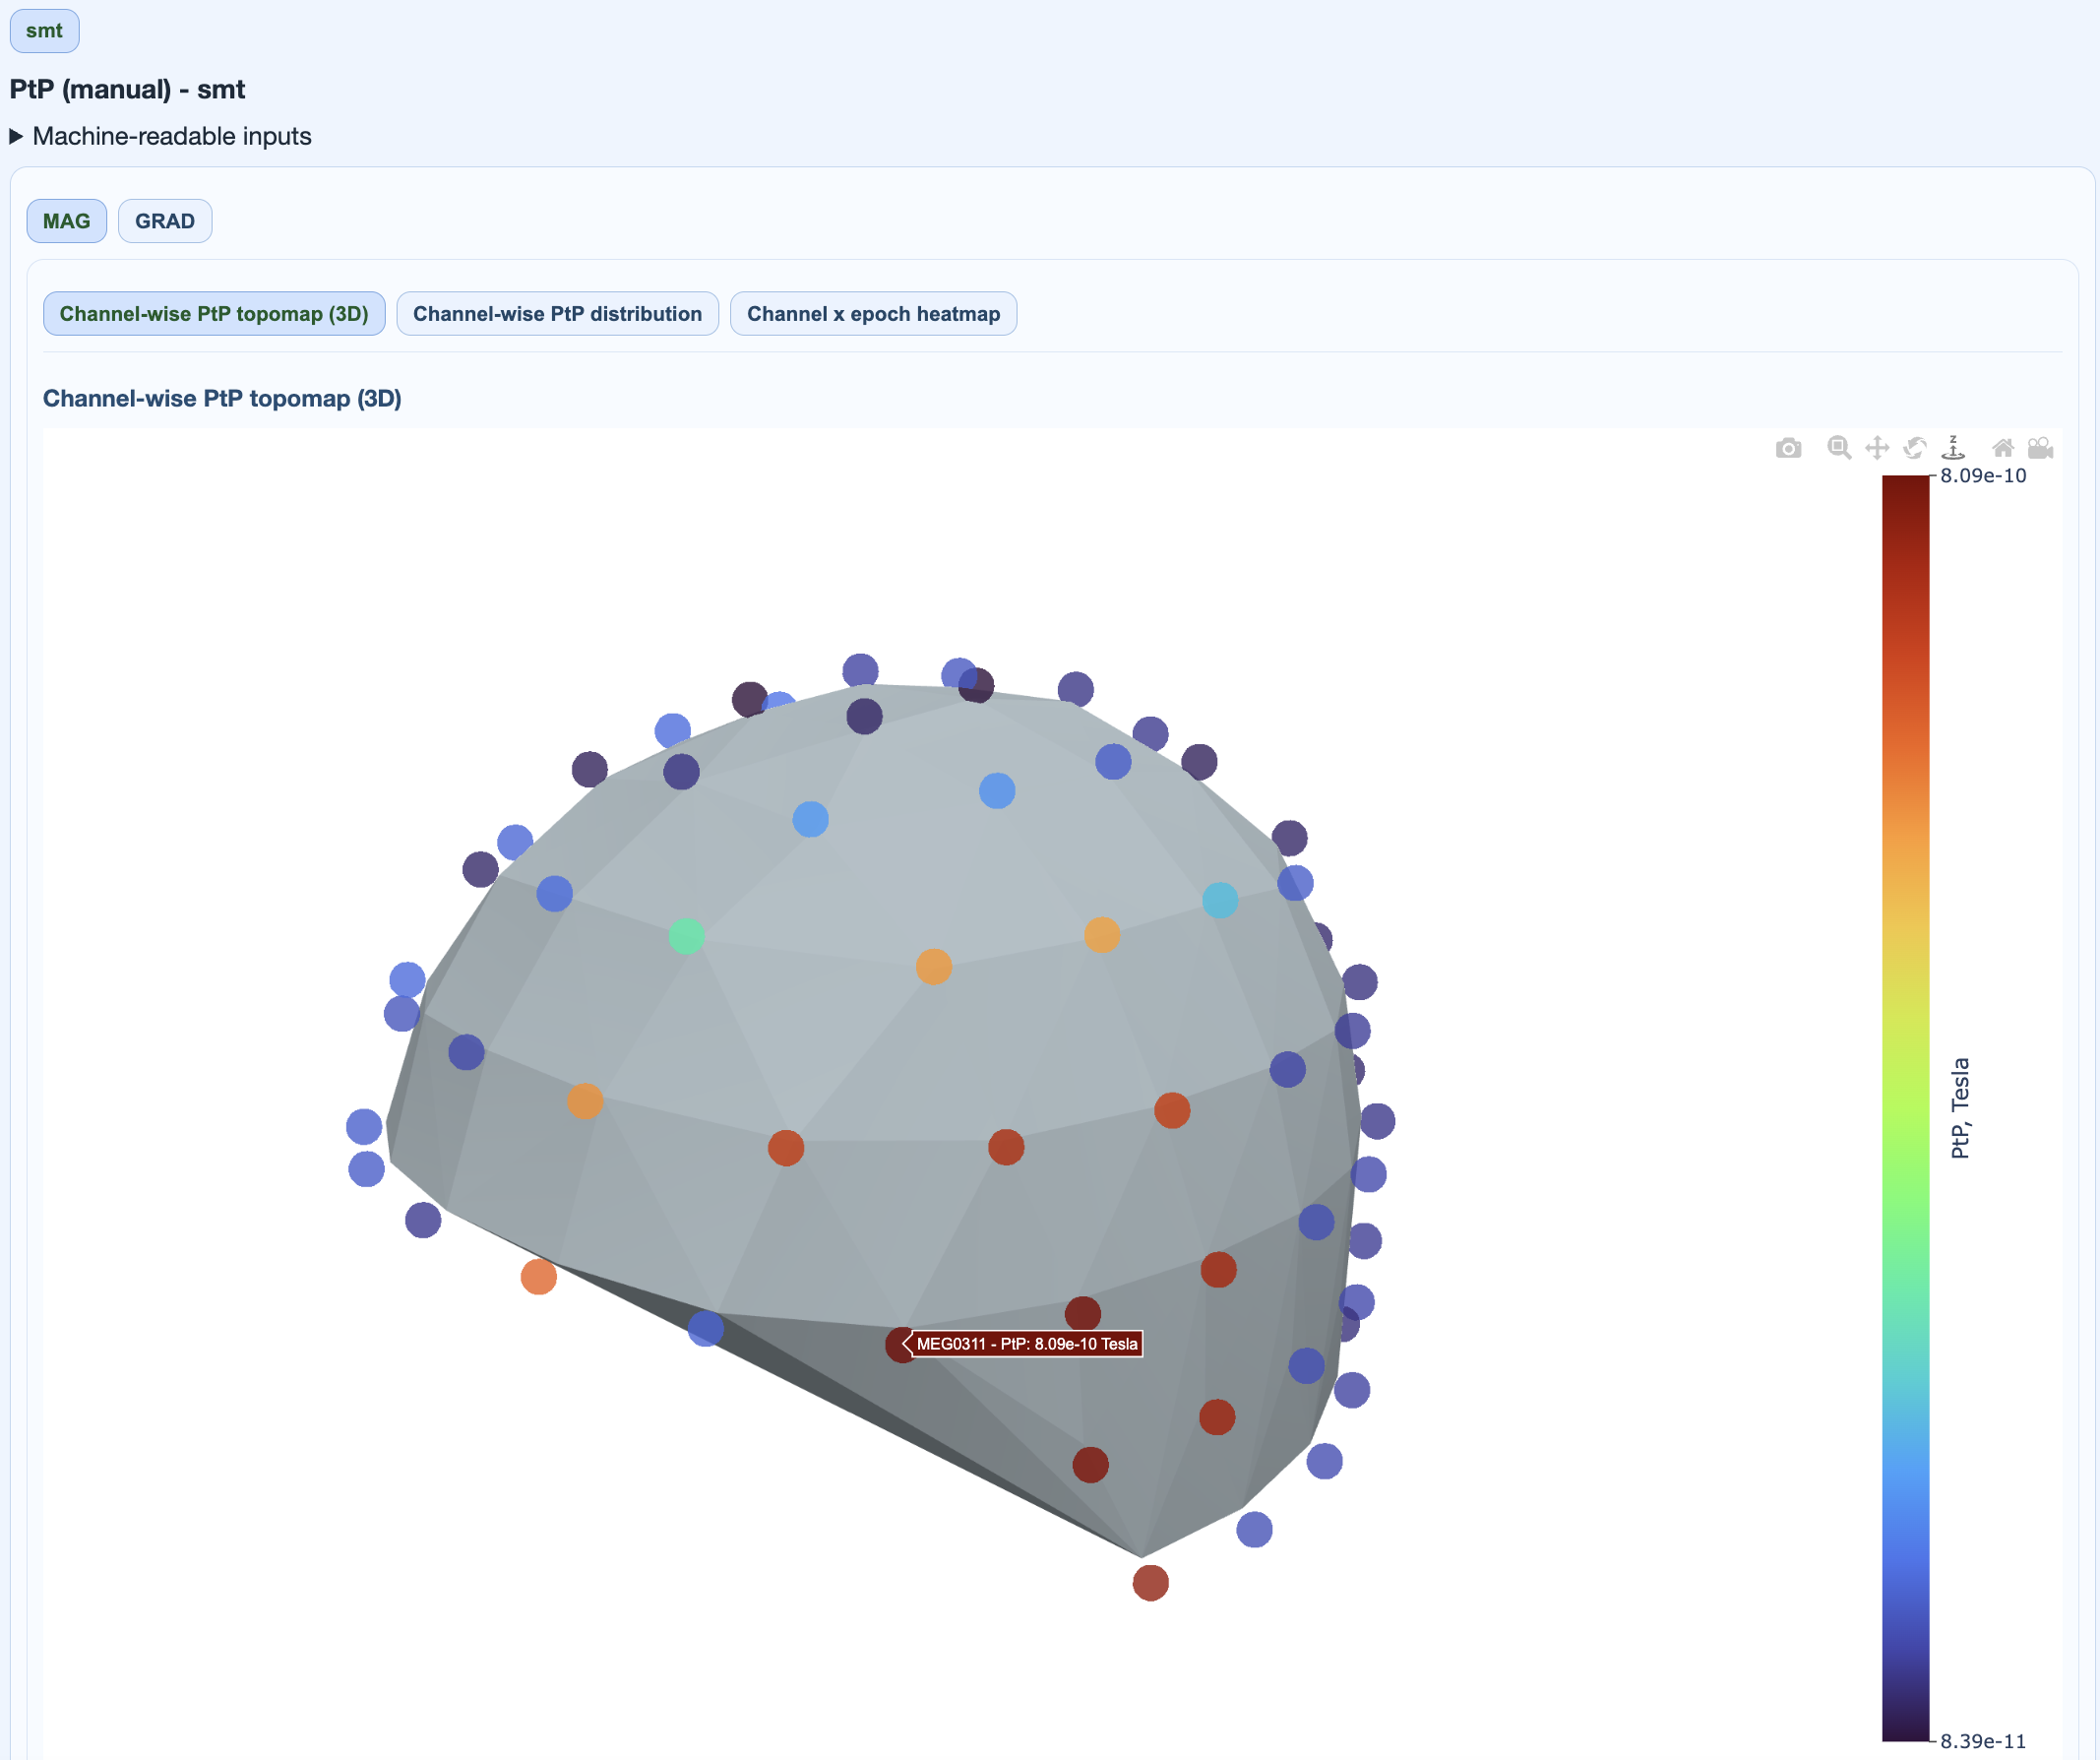
Interpretation:
focal extremes indicate spatially localized transients,
broad elevation suggests global bursts or movement-related effects.
2) Channel-wise PtP distribution#
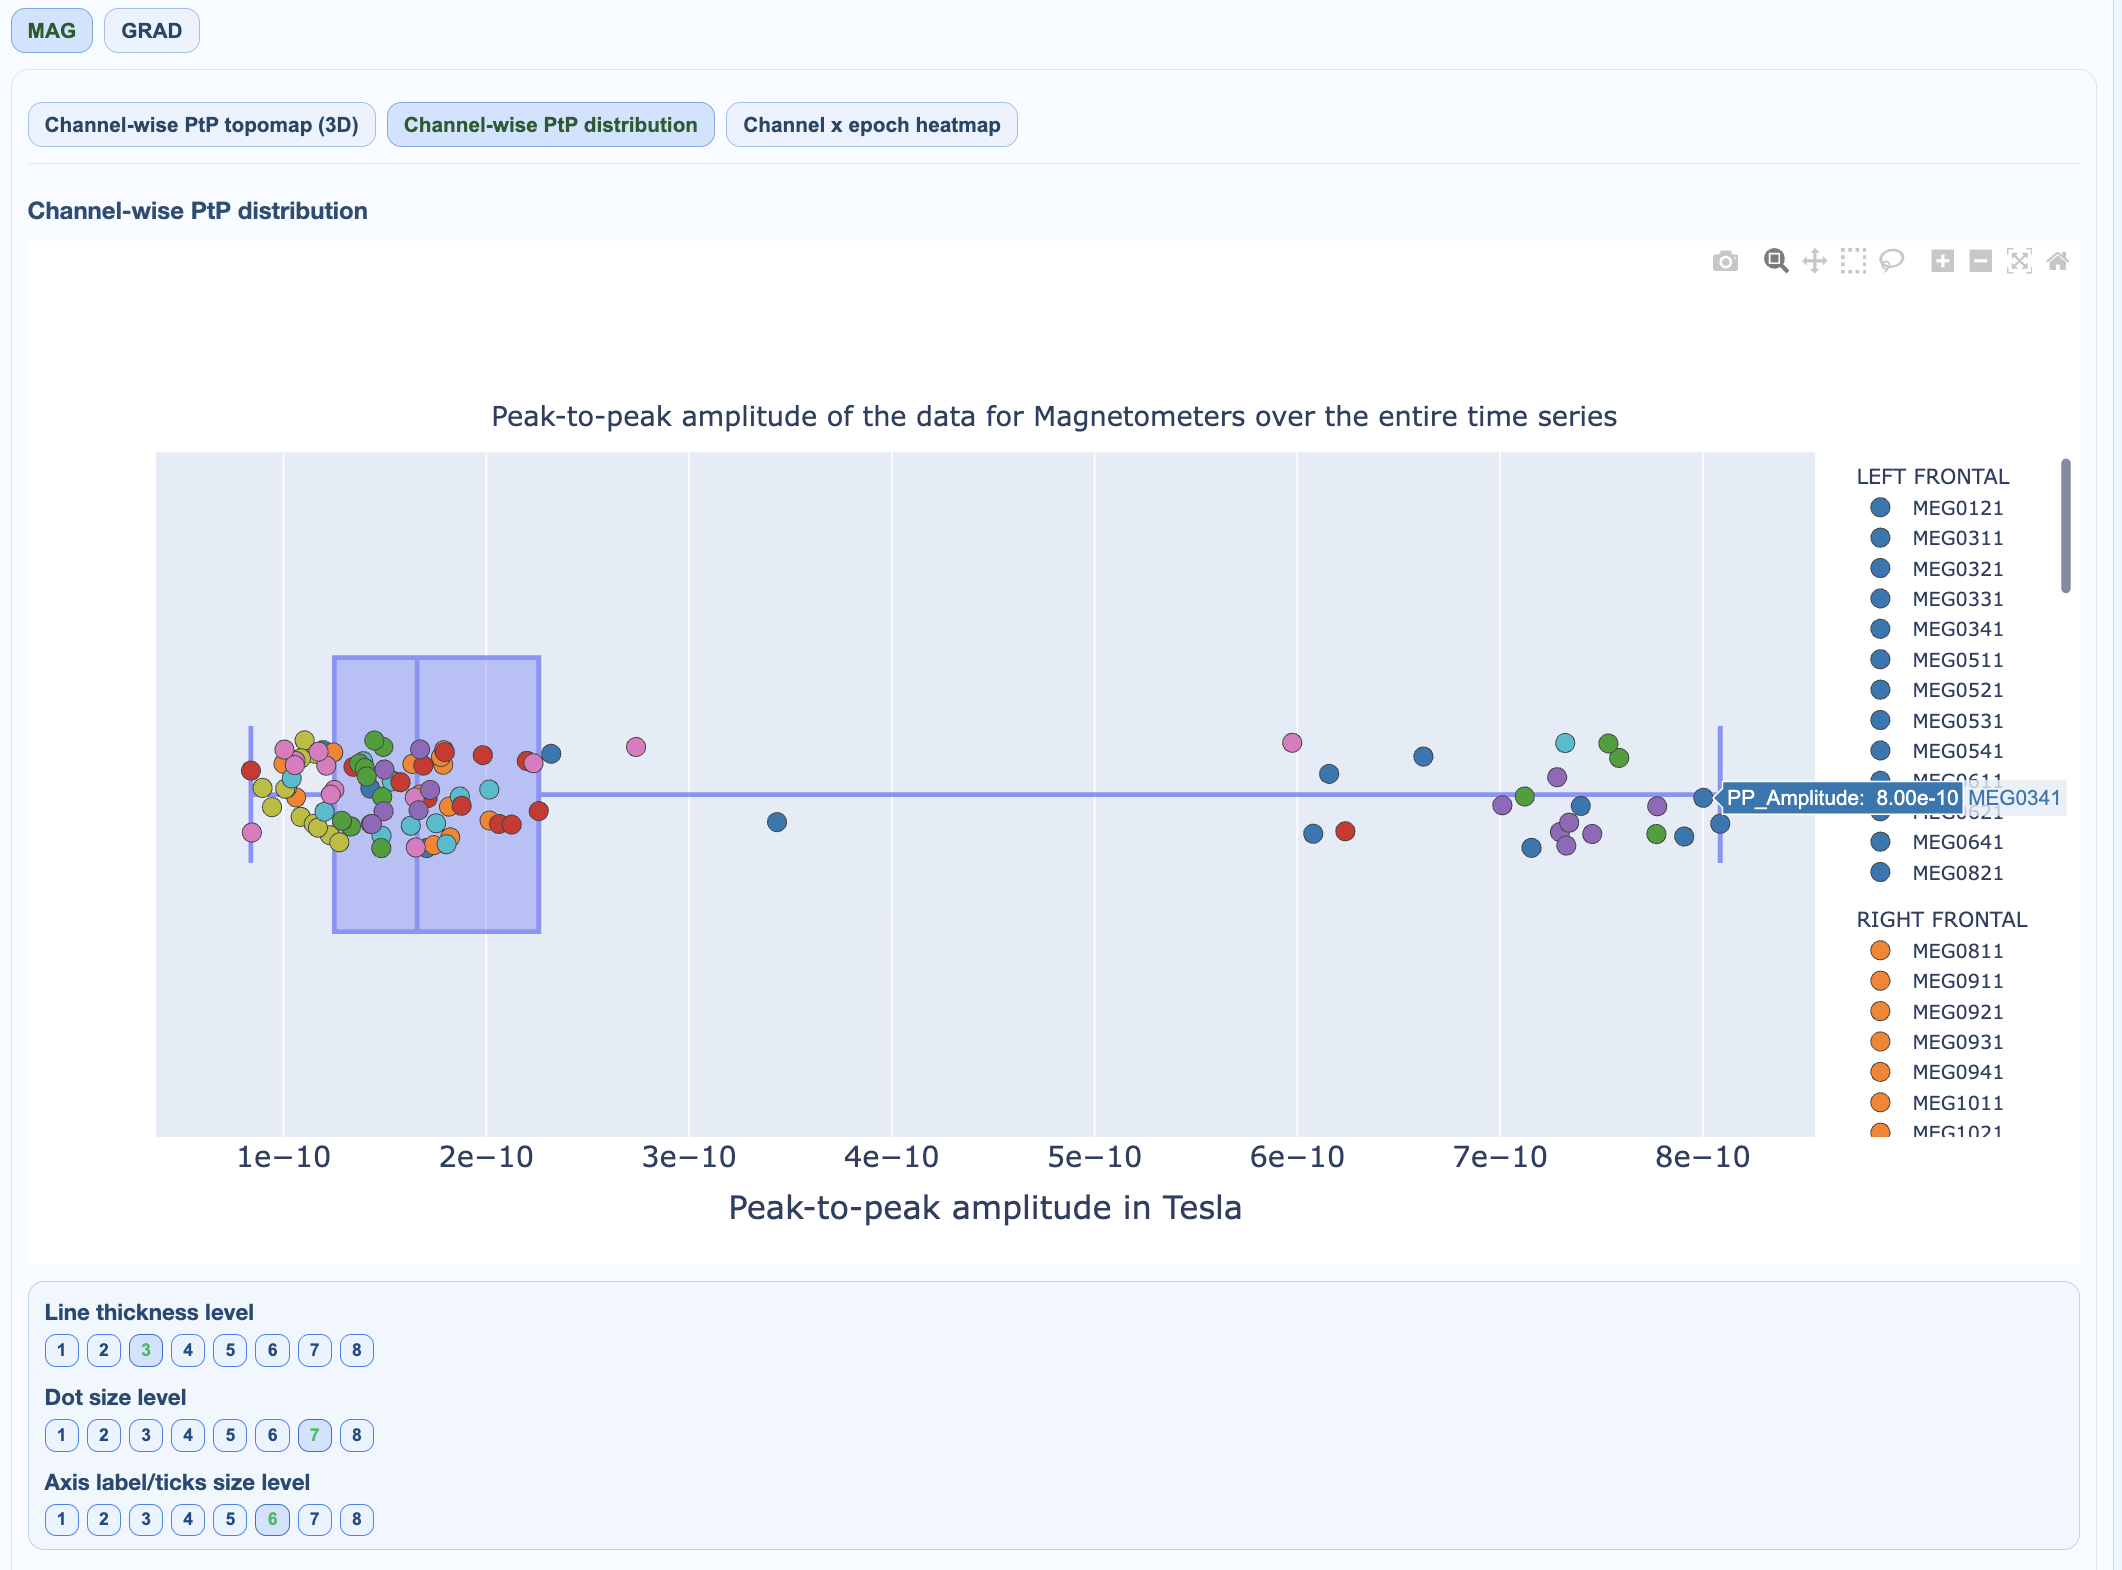
Interpretation:
long upper tail indicates burst-prone channels,
multi-modal distributions can indicate mixed channel populations.
3) Channel × epoch heatmap#
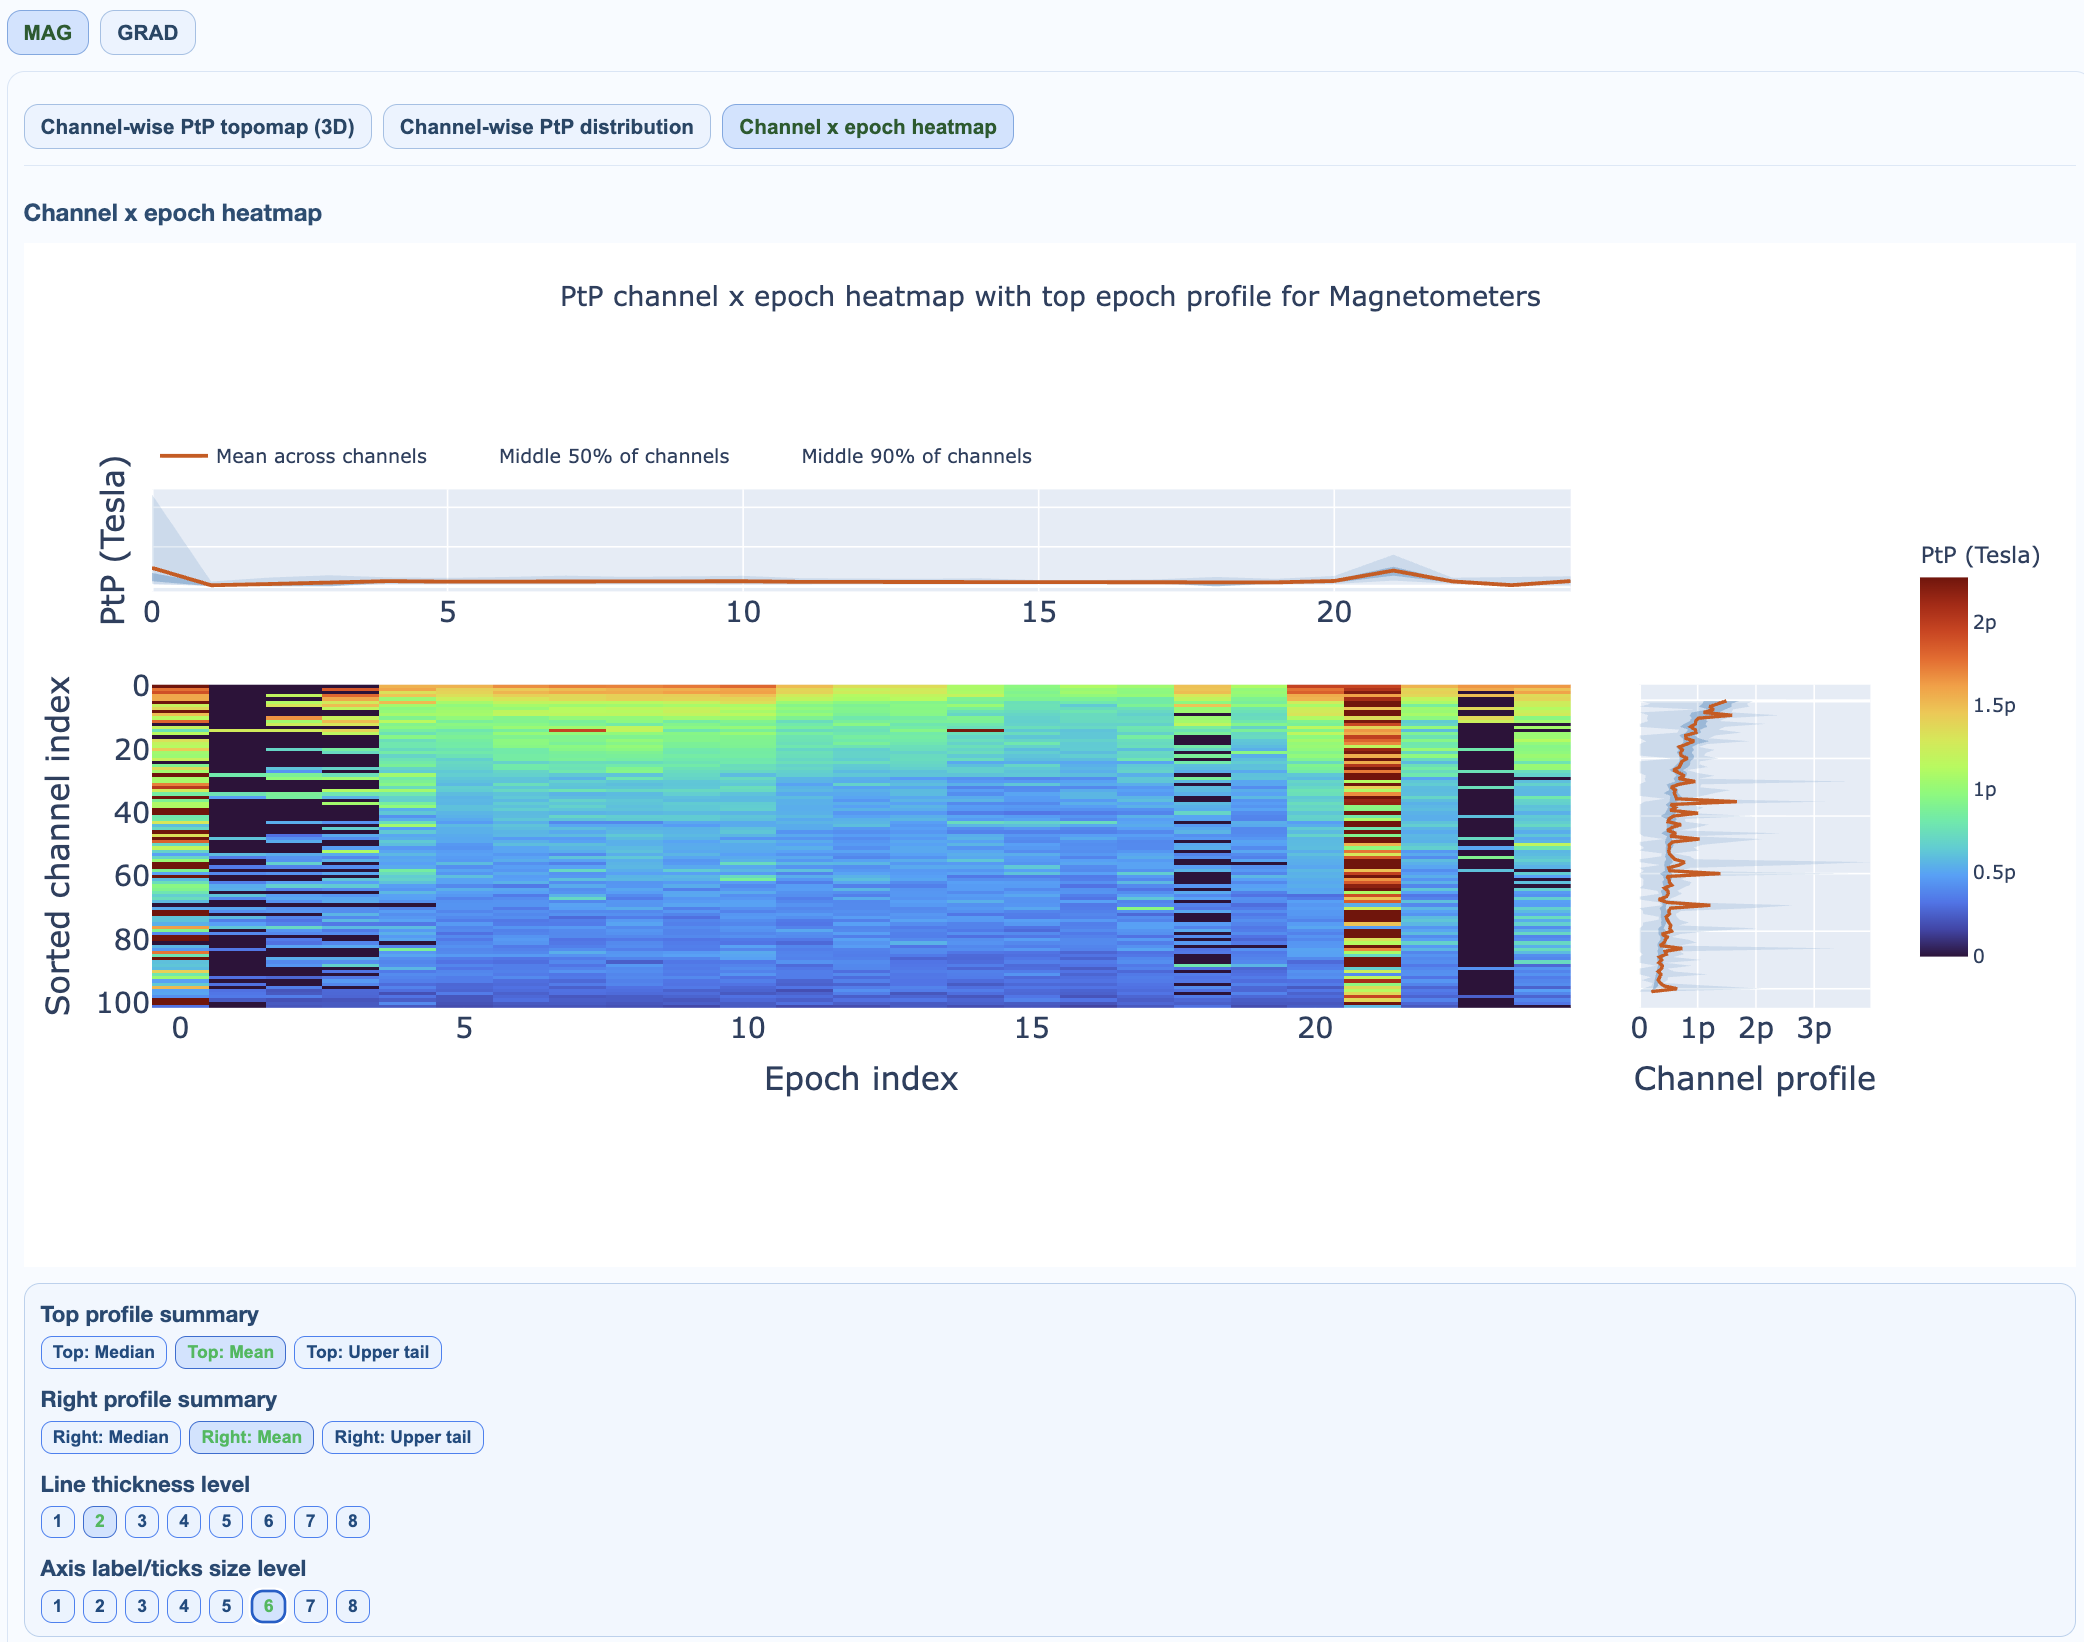
Interpretation:
vertical hot stripes: time-localized global excursions,
horizontal hot stripes: channel-specific recurrent burst behavior,
top/right profiles summarize epoch- and channel-level burden.
PtP (manual) vs PtP (auto)#
PtP (manual): MEGqc’s internal PtP pathway and thresholds.
PtP (auto): MNE-based automatic PtP pathway (when present).
Both can appear as separate tabs in subject reports. Compare them when validating threshold behavior.
QC implications#
persistent high-PtP channels are bad-channel candidates,
sparse high-PtP epochs can be rejected selectively,
combine with STD/PSD to avoid rejecting physiologically plausible high-amplitude signal.
The same visualization patterns apply to both MAG and GRAD channel types. PtP (auto) uses MNE’s built-in detection algorithm, while PtP (manual) uses MEGqc’s custom thresholding approach.