
Calculation Module (GUI)#
Open MEGqc:
megqc
Main window:
Calculation module panel:
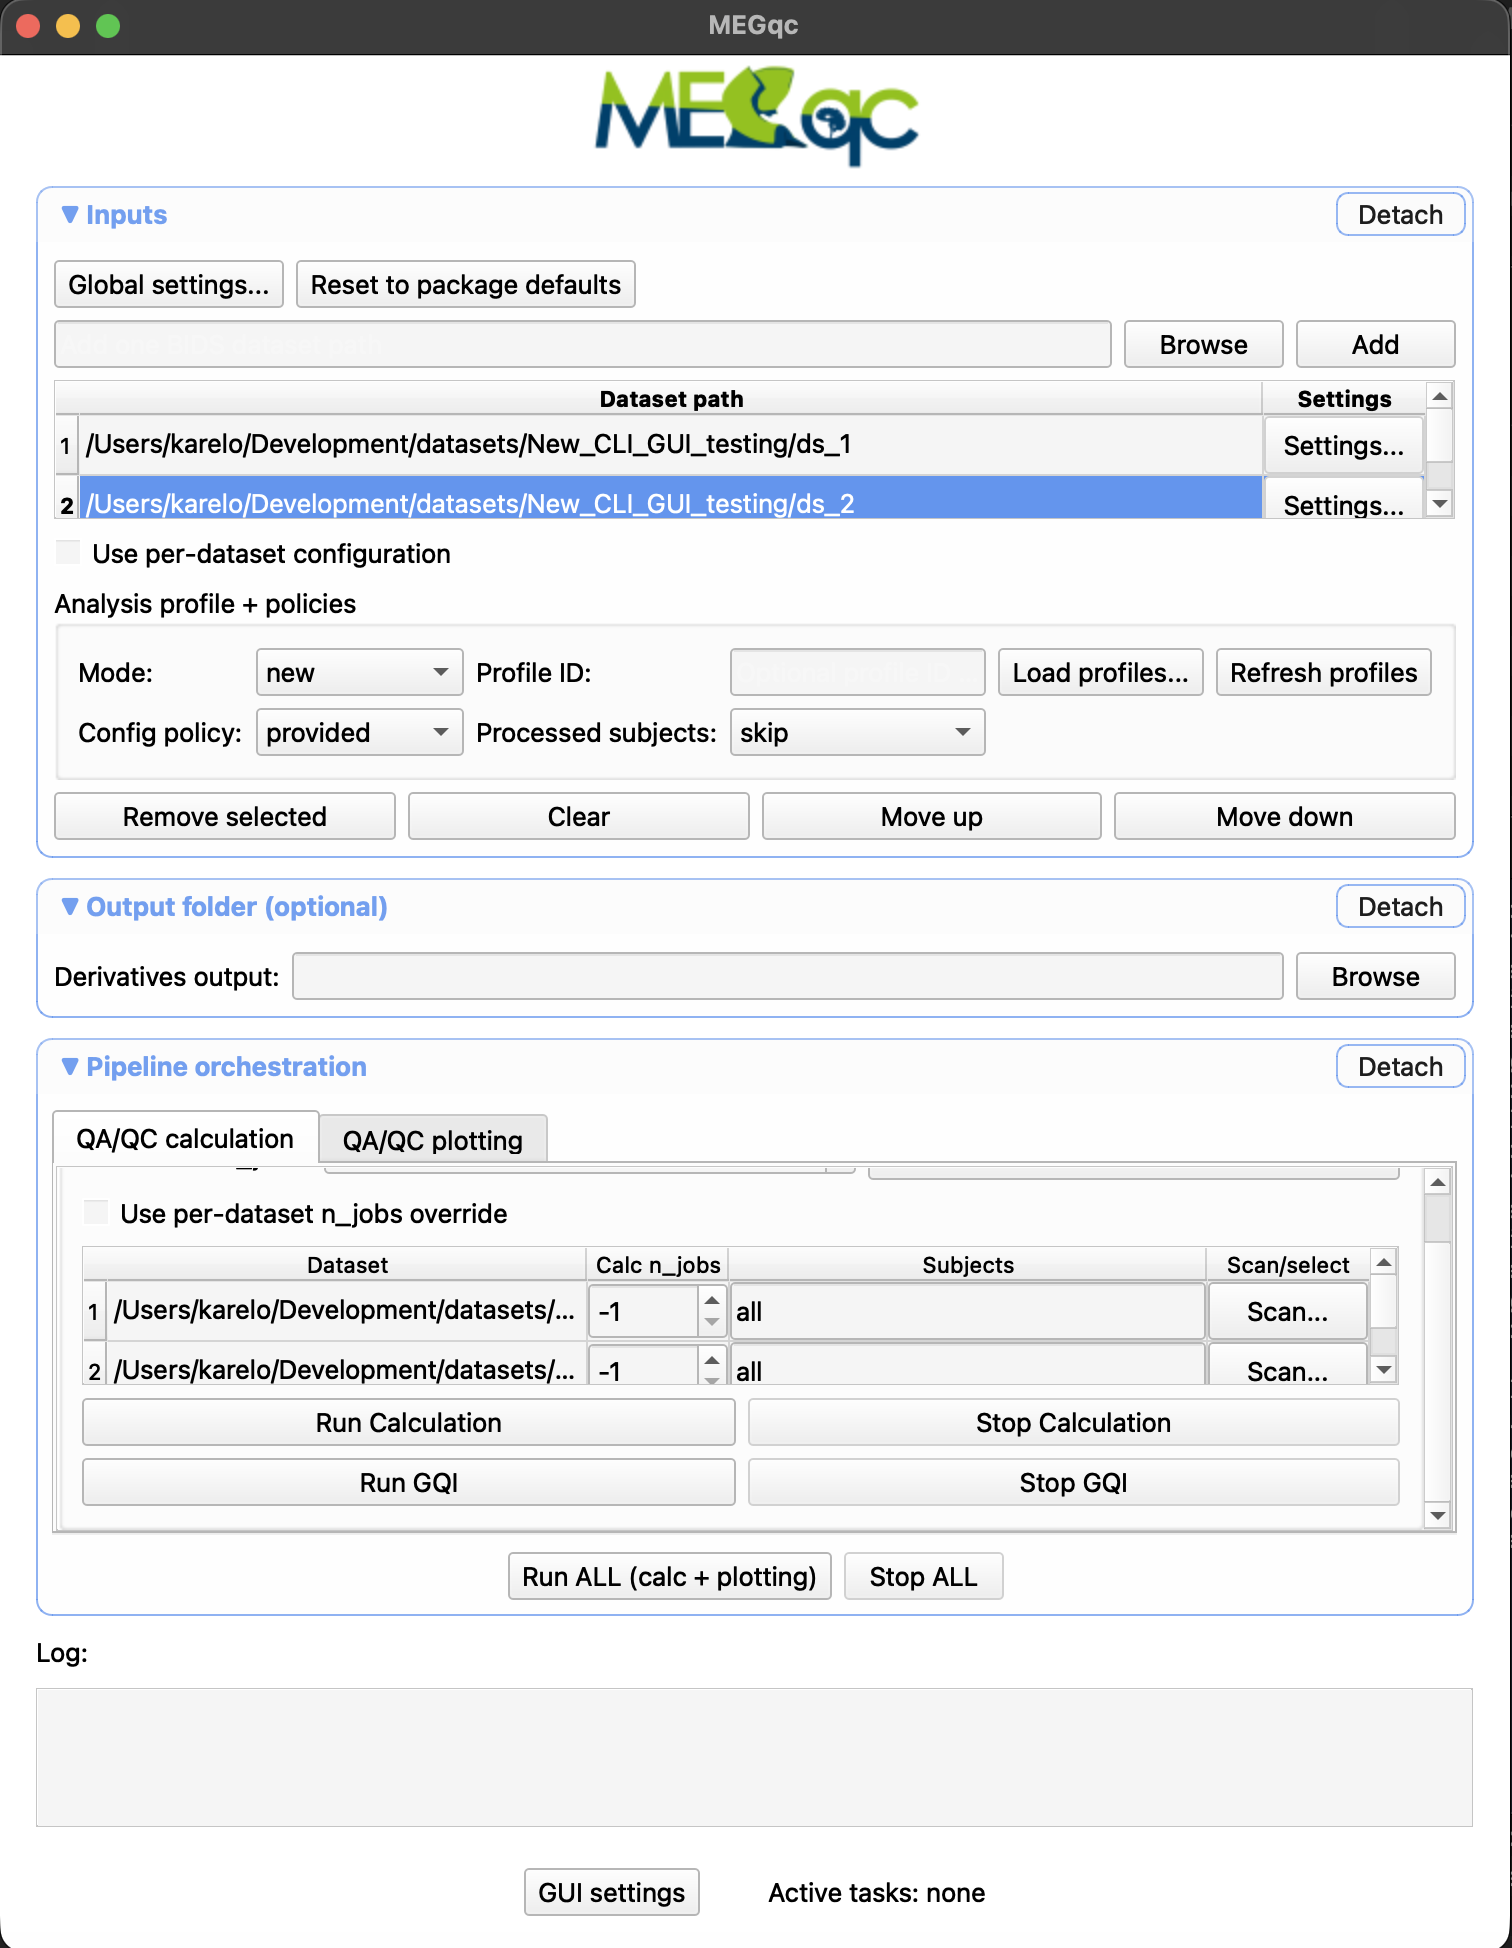
Step 1: Configure inputs#
In Inputs:
add one or multiple BIDS dataset paths,
optionally reorder/remove datasets,
select global settings or enable
Use per-dataset configuration.
Step 2: Set analysis profile and policies#
In Analysis profile + policies:
Mode:legacy,new,reuse,latestProfile ID: optional or required depending on modeConfig policy:provided,latest_saved,failProcessed subjects:skip,rerun,fail
Step 3: Optional output root#
In Output folder (optional) set Derivatives output only when outputs should be outside dataset roots.
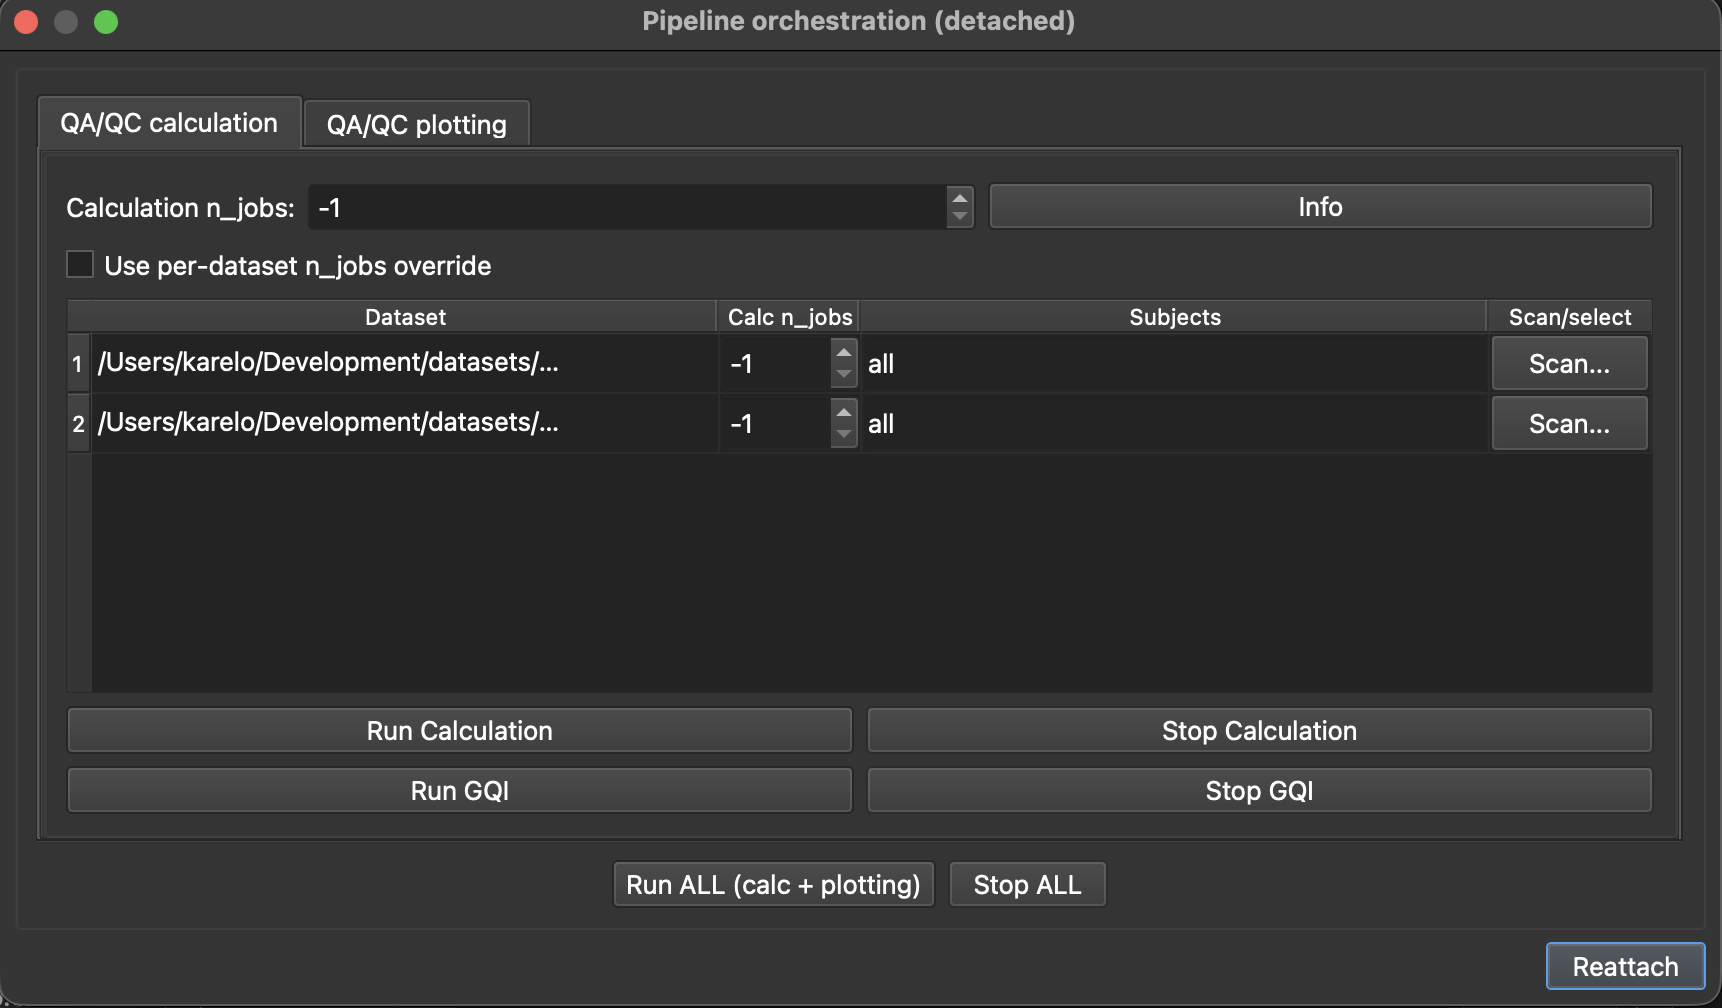
Step 4: Configure calculation runtime#
In QA/QC calculation tab:
set global
Calculation n_jobs,optionally enable per-dataset
n_jobsoverride,use per-dataset Scan/select for subject selection.
Step 5: Execute#
Run Calculation: calculation only.
Run GQI: recompute GQI attempts from existing metrics.
Run ALL (calc + plotting): full orchestration (calculation then plotting).
Stop buttons abort active tasks.
Example scenarios#
Scenario A: one dataset, all subjects, new profile#
add dataset,
set mode
new(optional explicit profile ID),keep subjects=
all,click Run Calculation.
Scenario B: two datasets, different configs and subjects#
add datasets A and B,
enable per-dataset config,
assign each settings file,
use Scan/select per dataset,
click Run Calculation.
Scenario C: full pipeline in one action#
configure plotting choices in QA/QC plotting tab,
click Run ALL (calc + plotting).
Runtime safety behavior
When one run starts, other run buttons are disabled until completion or stop.