
QA Subject Reports#
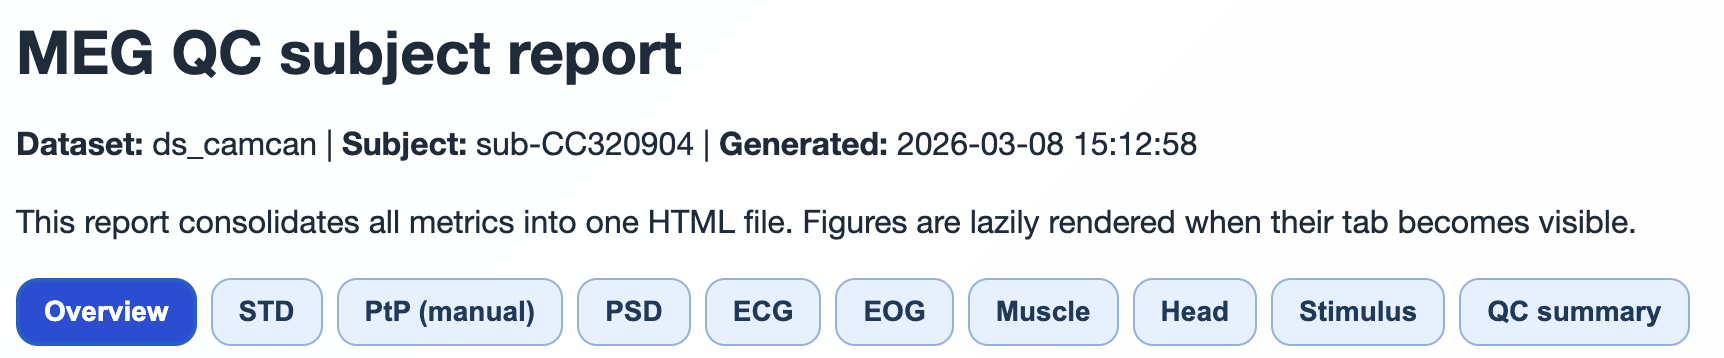
QA Subject reports are the main inspection artifact in MEGqc: one consolidated HTML per subject containing all available runs and quality metrics.
For execution instructions, see the Tutorial.
Top-level anatomy#
The report is structured as a nested tab hierarchy:
Hierarchy level |
Content |
|---|---|
Level 1 |
Top tabs ( |
Level 2 |
Run/task subtabs inside each top tab |
Level 3 |
Channel-type subtabs ( |
Level 4 |
Plot subtabs (metric-specific visualizations) |
Figures are lazy-rendered when the tab is opened to keep large reports responsive.
Top tab semantics#
Top tab |
What it contains |
Why it matters |
|---|---|---|
|
run/metric availability table, sensor geometry, per-run raw info |
validates completeness and data context |
Metric tabs ( |
run-specific QA visualizations |
localizes quality issues in time, frequency, and sensor space |
|
metric-specific summary text and SimpleMetrics tables; GQI attempt rows |
auditable QC-relevant descriptors by run/task |
Overview tab (what to inspect first)#
Run × metric availability table Confirms which metrics were computed for each run/task.
Sensor geometry (once per run) Sensor plots are centralized in
Overviewto avoid duplicating the same geometry in each metric tab.Raw header information Per-run metadata snapshot from raw info files.
The Overview tab provides essential context before diving into metric-specific analysis. It shows data completeness at a glance and helps identify any missing metrics or runs.
Metric tabs#
Each metric tab follows this pattern:
run/task subtabs,
channel-type subtabs (
MAG,GRAD, optionallyGeneral),plot subtabs for that metric.
Interpretation is documented in dedicated pages:
QC summary tab (detailed behavior)#
QC summary is metric-oriented and currently exposes metric tabs including GQI, PSD, ECG, EOG, STD, PtP (manual), PtP (auto), Muscle, Head, Stimulus, and INITIAL_INFO (when available in summary JSON).
GQI subtab#
For the current subject, GQI rows are collected from attempt files:
summary_reports/group_metrics/Global_Quality_Index_attempt_<n>.tsv
Rows are filtered by subject and shown by task and attempt.
Metric subtabs (PSD/ECG/EOG/STD/PtP/…)#
For each run/task subtab:
Report summary text (from report strings JSON),
Metric-specific compact summary (for PSD and ECG/EOG),
SimpleMetrics details table preserving nested structures,
Derivative source list with exact file paths.
This design allows quick reading first, then auditable deep inspection.
The QC summary tab is essential for understanding the automated quality assessment results and tracking how GQI scores were computed for each run.