Editor Tab#
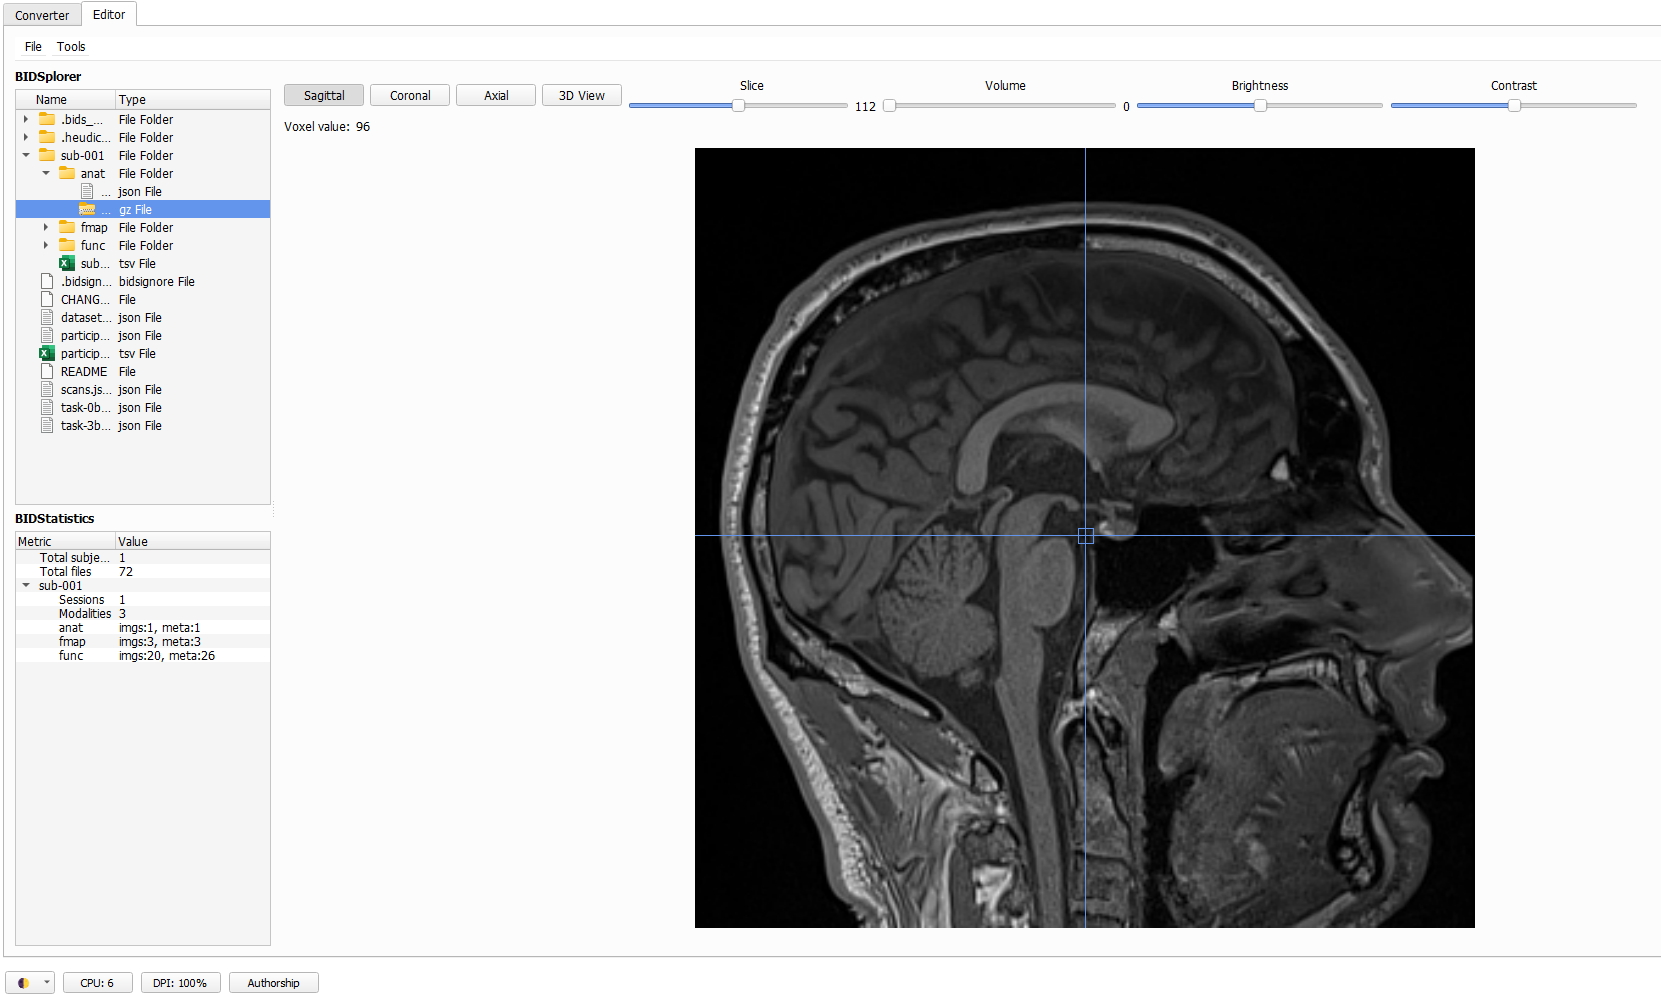
The second tab in BIDS-Manager is the Editor. It lets your preview and edit metada (.json and .tsv files) and imaging data (DICOMS, NIfTI volumes…).
Load your dataset#
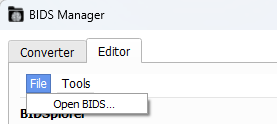
Go to the top menu and click File, in the dropdown select Open BIDS..., then a file browser will appear. Navigate to the root or absolute folder of your BIDS dataset (the top-level directory that contains all subfolders).
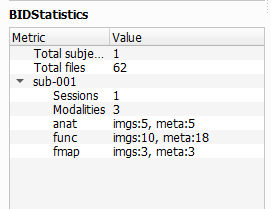
Once you’ve load your dataset, BIDStatistic will show you a summary of your dataset, such as total amount of subjects and files, as well as sessions and sequence types per subject.
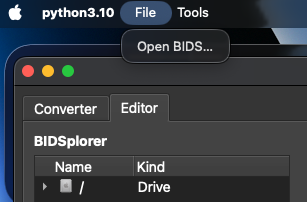
Note for macOS users
On macOS, the File and Tools menus are not inside the BIDS Manager window, instead they appear in the system menu bar at the top of the screen.
BIDSplorer#
Once you’ve loaded your dataset, you can use BIDSplorer to easily navigate through your dataset subfolders and view different type of files and sequence types.
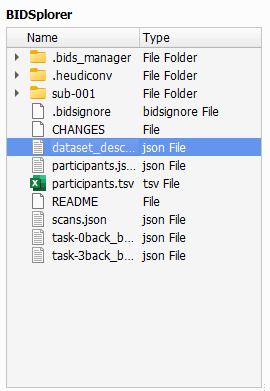
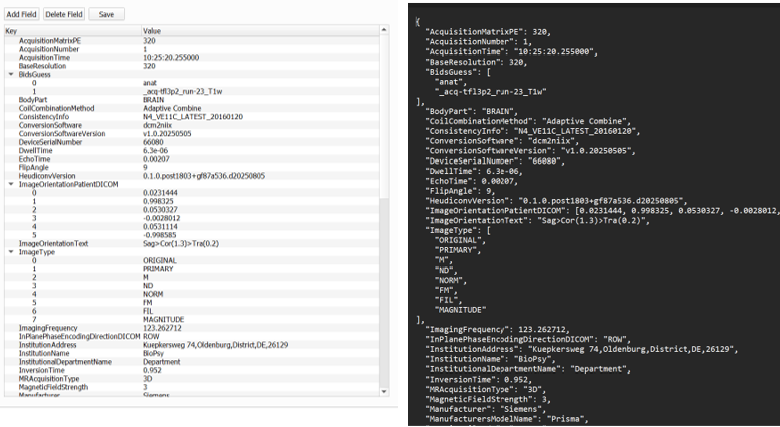
Metadata and Sidecars: Double-click on the json and tsv files to open them, review them and modify entries.
For tsv files, you can
AddandRemoveColumnsandRows.For json files, you can easily
AddandDelete Fields, without opening a text editor and manually editing.
Changes can be saved with the
Savebutton (it overwrites the original file).
Hidden Folders
BIDSplorer also let you access hidden folders such as:
.bids_manager: which contains the following tsv files:subject_mapping.tsv: simple list of all subjects, without age and gender.
subject_summary.tsv: all data scanned, metada and sequences types, and the rules to include it or not.
.heudiconv: stores the the conversion heuristics files.
Sequence type view: BIDSplorer can open NIfTI images (.nii/.nii.gz) across different sequence types (anat, func, fmap, dwi). Use the different option to
Inspect the three orthogonal planes with the
Axial,CoronalandSagittalbuttons.
Scroll through the 2D cross-sections of the current plane with the
Slicestoggle.
Adjust
brightnessandcontrastto improve visibility.
For functional (BOLD) images, you can scroll through time using the
volumetoggle.
BIDSplorer includes a
Graphoption for functional images that allows to see the how the signal changes over time. The graph along with thevolumetoggle will help you spot “jumps” or big irregularities that could be cause by the participant movements or scanner artifacts.
Expand the graph with the
Scopeoption (at the bottom of the screen) to include neighboring voxels, which can make artifacts easier to localize. You can also adjust theDot sizeor hide the neighboring dots.
Next section#
In the next section we will get see how to use the different tools of the Editor tab to rename batches of files, add fieldmap images to function images, and more.