
Learn · Chapter 6 of 15
Checking before you convert
See the dataset the conversion will write before a single file is written, and what differs from one subject to the next. Two places do this: the three views of the panel beside the table, and the Overview in place of the table.
The panel beside the table
The panel between the trees and the table shows the scan table as a tree. It has no fixed name: its title says which of its three views is on (Structure, Recordings or BIDS preview); the three icons beside the title switch between them.
| View | What it shows |
|---|---|
| Structure | Subjects, sessions, datatypes and the BIDS names under them |
| Recordings | Each kind of recording, and which subjects have it |
| BIDS preview | Every file the conversion will write, and what each will contain |
Click a folder row of a tree to fold it open or closed; a click on a recording selects it. Selecting a file selects its row in the table, and the other way round.
Structure
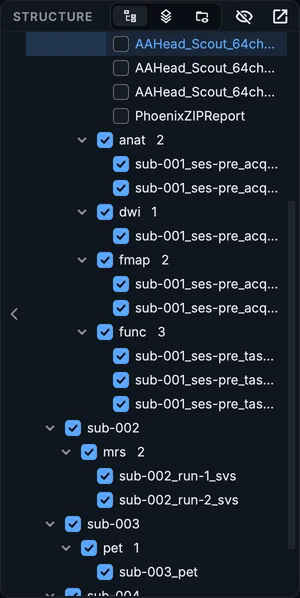
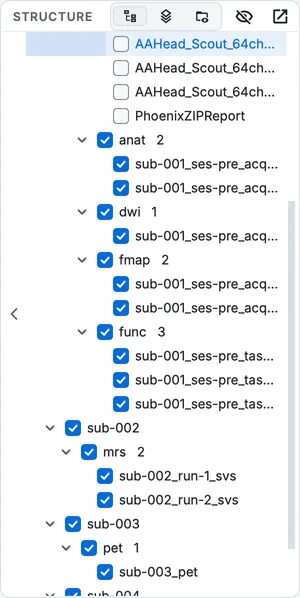
The Structure view right after the scan, before chapter 4's edits.
Right after the scan, the Structure view shows the problem chapter 4 fixed: four subjects and three sessions, and the rows the scan left out under (no datatype). Each branch has a checkbox: untick a session or a datatype to leave all of it out of the conversion. The eye icon, Hide rows left out, hides the unticked rows so the tree shows only what will be converted.
Recordings
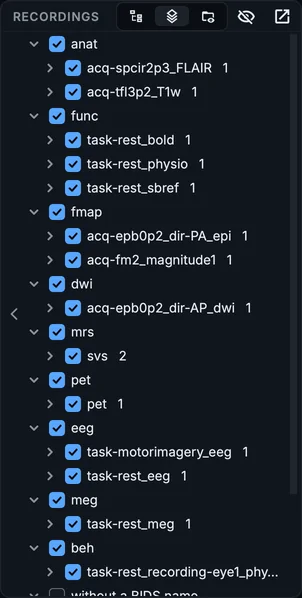
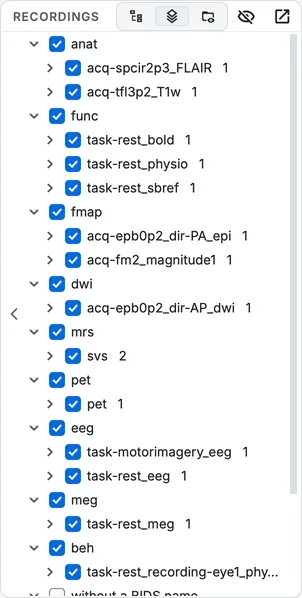
The Recordings view.
Recordings groups the rows by what they are rather than by whom: every T1w with this acquisition label, every BOLD run of this task. The number is how many recordings of that kind there are; hover the line to see how many subjects they come from. In a study of many participants this is where a recording one person is missing, or has twice, shows up. Its checkbox ticks or unticks that kind of recording for everyone.
BIDS preview
Step 1. Open the BIDS preview
Click the third icon in the panel's title. The panel becomes BIDS preview: the dataset as the conversion will write it, including the files at its top (dataset_description.json, participants.tsv, README) and the scans.tsv of each session.
Step 2. Select a sidecar
Open sub-001, ses-01, func and click sub-001_. The lower half shows what the file will contain.
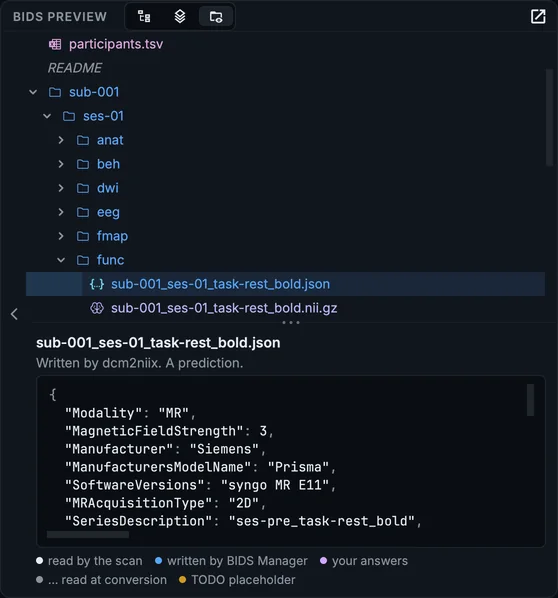
The BIDS preview with the BOLD run's sidecar selected.
Each value is coloured by where it comes from: read by the scan, written by BIDS Manager from the table and the settings, your own answers (chapter 7), read only at conversion (shown as …), and a TODO placeholder for a field nobody has answered. The legend is under the content.
A file written only in some cases is dim and italic; hover it, or select it, to read when it is written. A file the conversion will write but that is not valid BIDS (a series dcm2niix splits into pieces BIDS has no name for) is in the warning colour, with the reason. The preview is made by running the conversion's own steps on what the scan read, so it matches what the conversion writes. How it does that, and where it cannot know yet, is in What the BIDS preview predicts.
The Overview
A table of rows cannot show what is consistent across subjects. The Overview can.
Step 3. Switch the Inspection panel to Overview
Click Overview in the Inspection panel's title.
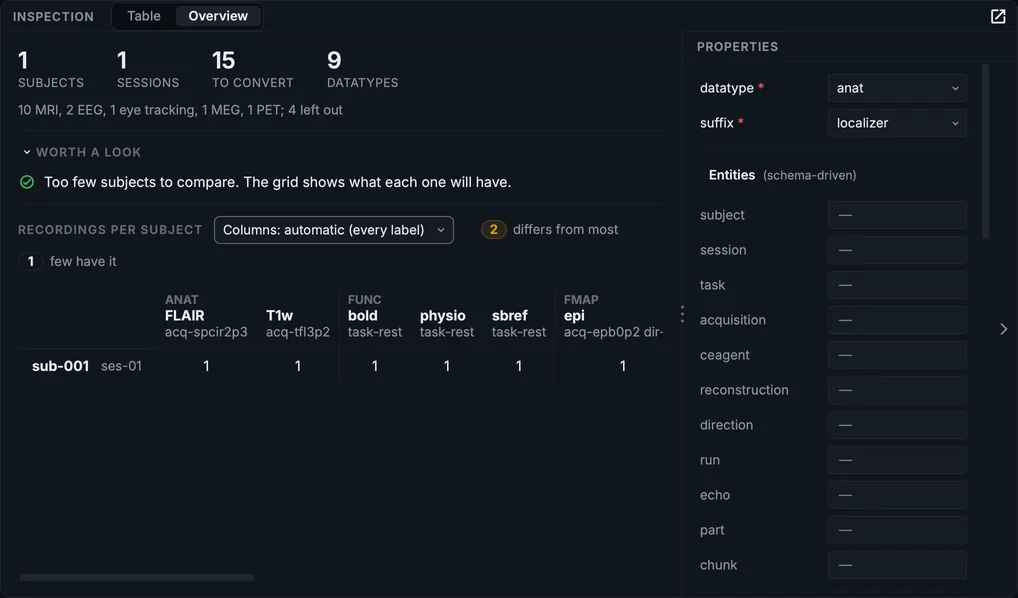
The Overview after chapter 4: one subject, one session, 15 recordings to convert.
At the top, the counts: subjects, sessions, recordings to convert and datatypes, with a line saying what kinds of recording there are. Below, Worth a look lists findings, and Recordings per subject is a grid with one row per subject and session and one column per kind of recording.
With one participant there is nothing to compare, and the Overview says so: Too few subjects to compare. Here is the same view right after the scan, before chapter 4's edits:
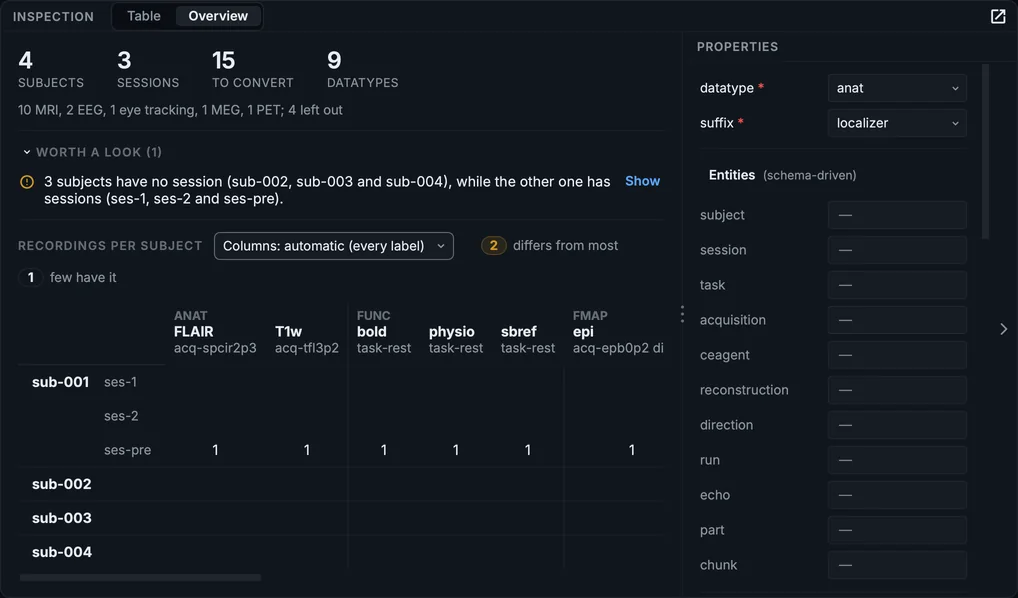
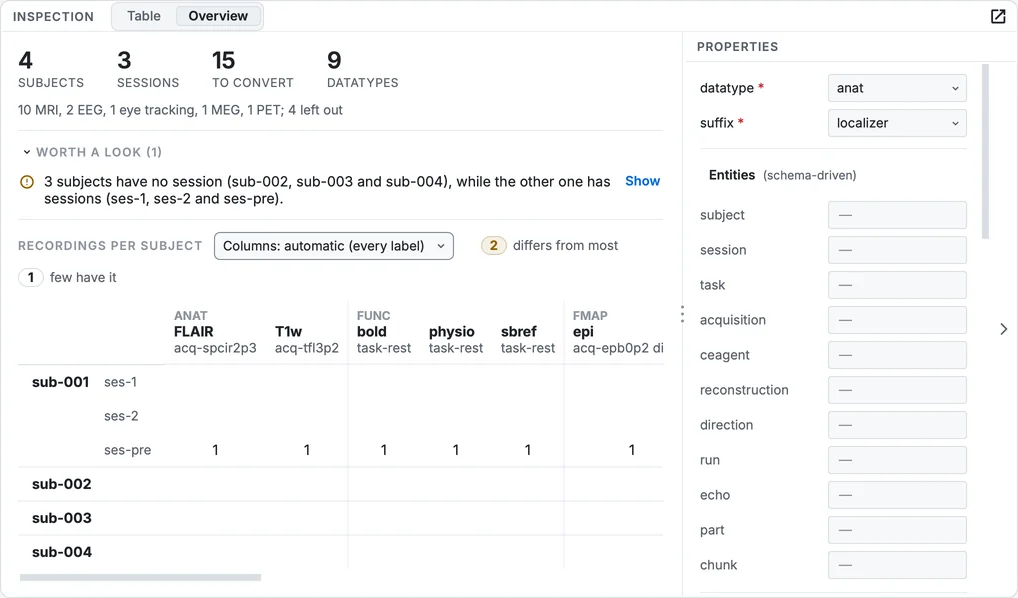
The Overview right after the scan: four subjects and a finding.
It found what chapter 4 fixed: 3 subjects have no session (sub-002, sub-003 and sub-004), while the other one has sessions (ses-1, ses-2 and ses-pre). Click Show beside a finding to open the table on the rows it is about.
What the Overview looks for, across subjects of the same modality:
- a subject with fewer or more recordings of a kind than most comparable subjects have;
- a label spelled two ways (
task-restandtask-Rest); - labels that look like identifiers or file names rather than labels;
- subjects without a session among subjects with sessions;
- several sessions recorded on the same day;
- two recordings that would get the same name.
In the grid, a count that differs from what most subjects have is drawn as a pill, and a kind of recording only a few subjects have is outlined. Click a cell to select its rows; double-click it to open them in the table. Columns: chooses how finely the columns split: Automatic (the default, the finest split that stays readable), Every label, Task only, or Datatype and suffix.
Your progress is kept in this browser only.